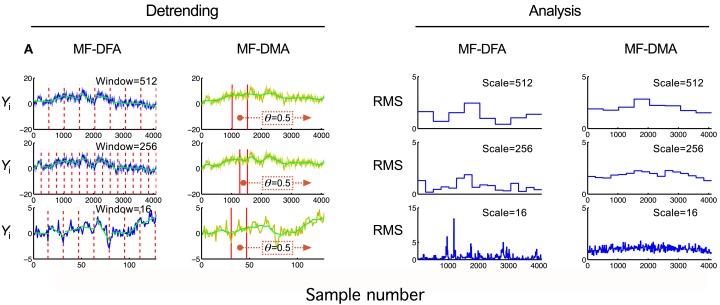
Figure 4.
Detrending scheme and fluctuation analysis for MF-DFA and MF-DMA methods. The detrending strategy for MF-DFA (A) is that the signal is divided into a set of non-overlapping windows of different sizes, and a local low-order polynomial (typically linear) fit (shown in green) is removed from each window’s data. In contrast, MF-DMA (B) removes the moving average point-by-point calculated in different window sizes around the processed point with a position given by θ. This parameter describes the delay between the moving average function and the original signal. Its value is taken from [0, 1] interval, 0 meaning only from signal values on the left (“backward,” past), in contrast with 1 meaning that only signal values to the right (“forward,” future) are used for calculating The centrally positioned sliding window corresponds to the case of θ = 0.5 balancing contributions from the past and the future to the reference point. The approaches of MF-DFA and MF-DMA thus ought to yield different detrended signals, whose calculated moments (C,D) and Eqs 33 and 34 obtained by the analysis should also be somewhat different.

