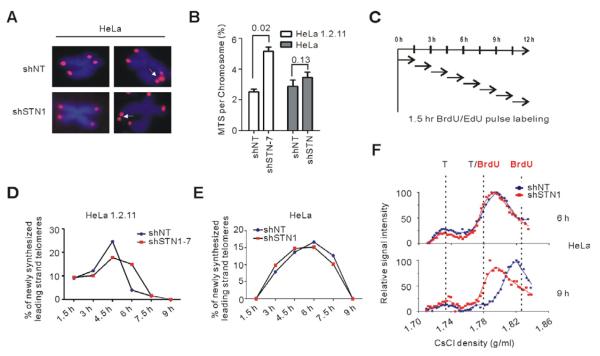
Figure 4. STN1 participates in telomere duplex replication and C-strand fill-in.
(A) Telomere FISH on HeLa with short telomeres. Arrows indicate occasional MTS. (B) Quantification of MTS (mean ± SEM, n = 3 exp., p-values are shown). (C) Experimental time-line. HeLa or HeLa 1.2.11 cells were released into S then incubated with BrdU or EdU for consecutive 1.5 hr intervals. (D-E) Amounts of telomere replication throughout S. Graphs from representative experiments show percent of leading daughters that completed replication relative to total telomere signal for each time period in HeLa 1.2.11 clones (D) or HeLa pools (E). (F) Detection of delayed C-strand fill-in in HeLa with short telomeres. Overhangs were detected by slot blot, signals quantified and plotted versus density (representative experiment).

