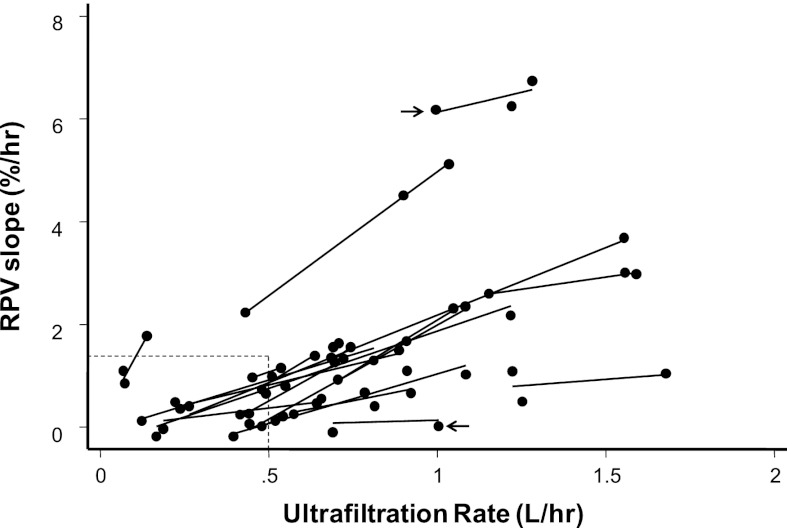
Figure 3.
Relationship between ultrafiltration rate (UFR) and RPV slopes for each of the 20 patients. Each data point represents RPV slope (percent per hour) and UFR for a single hemodialysis (HD) session for an individual. Each line reflects regression of UFR on RPV over three consecutive HD sessions for the same individual. Arrows show that RPV slopes can be remarkably different for the same UFR between individuals. Lower left rectangle indicates data points with UFR<0.5 L/h and RPV slope<1.33%/h. Additional details are in the text.

