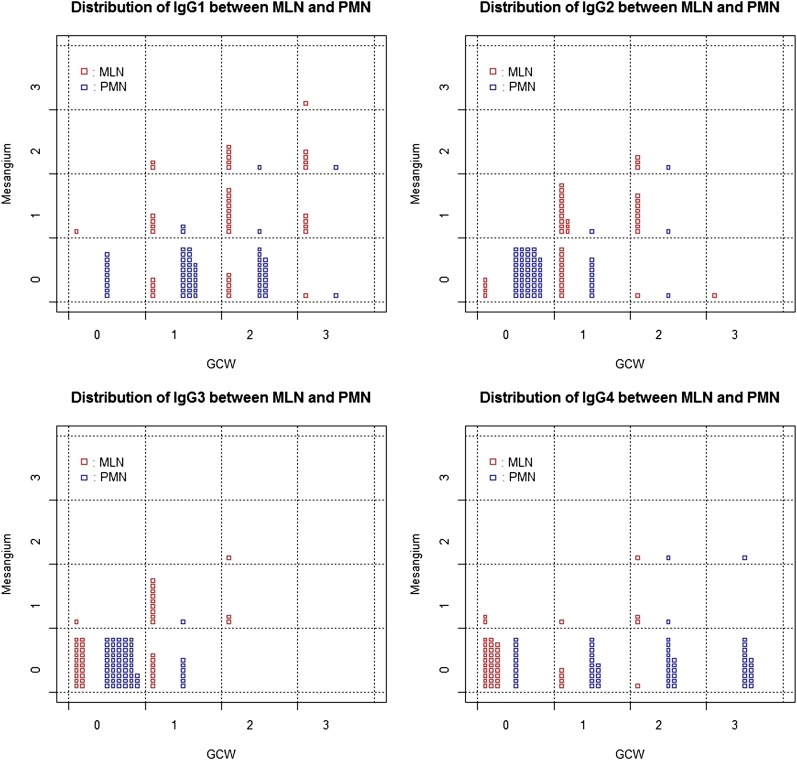
Figure 3.
Scattergrams with jittering showing the distribution of the immunofluorescence intensities of each IgG subclass both in the glomerular capillary wall (GCW) and mesangium between membranous lupus nephritis (MLN) and primary membranous nephropathy (PMN). The x-axes represent immunofluorescence intensities in GCW and the y-axes represent that in mesangium. A small rectangle in the cells represents a patient with either MLN (red) or PMN (blue) and the counts of the rectangles in each cell show the counts of the patients with the corresponding immunofluorescence value. MLN patients tend to show strong intensity for IgG1, IgG2, and IgG3 along the GCW and/or in the mesangium, whereas PMN patients tend to show strong intensity of IgG1 and IgG4 along the GCW.

