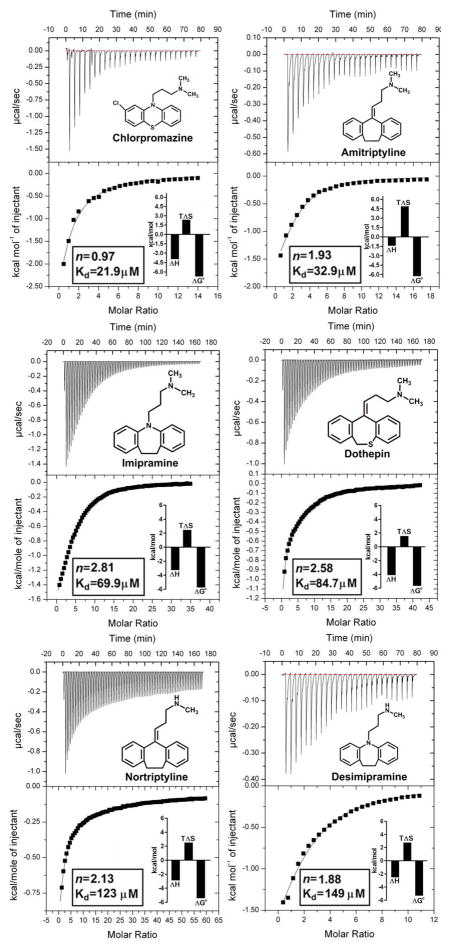
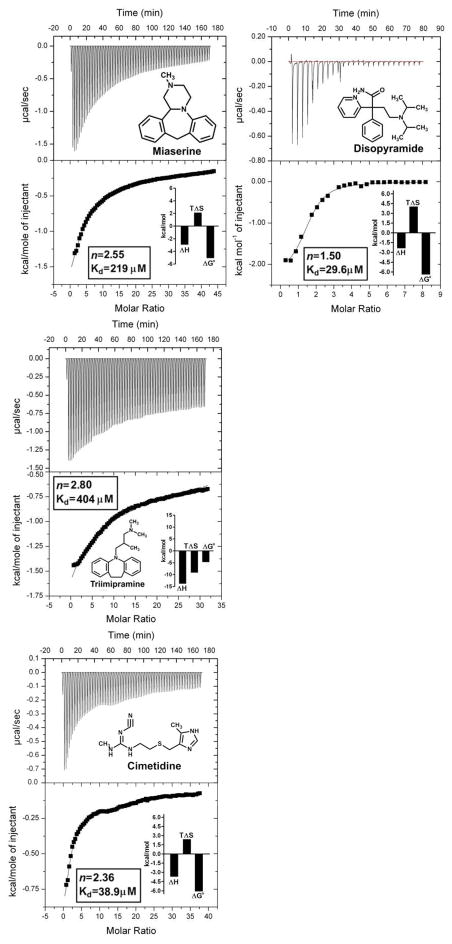
Figure 1.
Isothermal Titration Calorimetry measurement of drug-AGP binding interactions. Top panels show the heat in μcal/sec per injectant. Bottom panels show the enthalpy (kcal/mol) as a function of the drug-AGP molar ratio. All titrations were performed at 30°C. The insets show the stoichiometry (n), binding affinity (Kd) and thermodynamic parameters (ΔH°, enthalpy; TΔS°, entropy; ΔG°, free energy) for each interaction derived from a one site model fit of the binding isotherms. The chemical structure of each test compound is shown.


