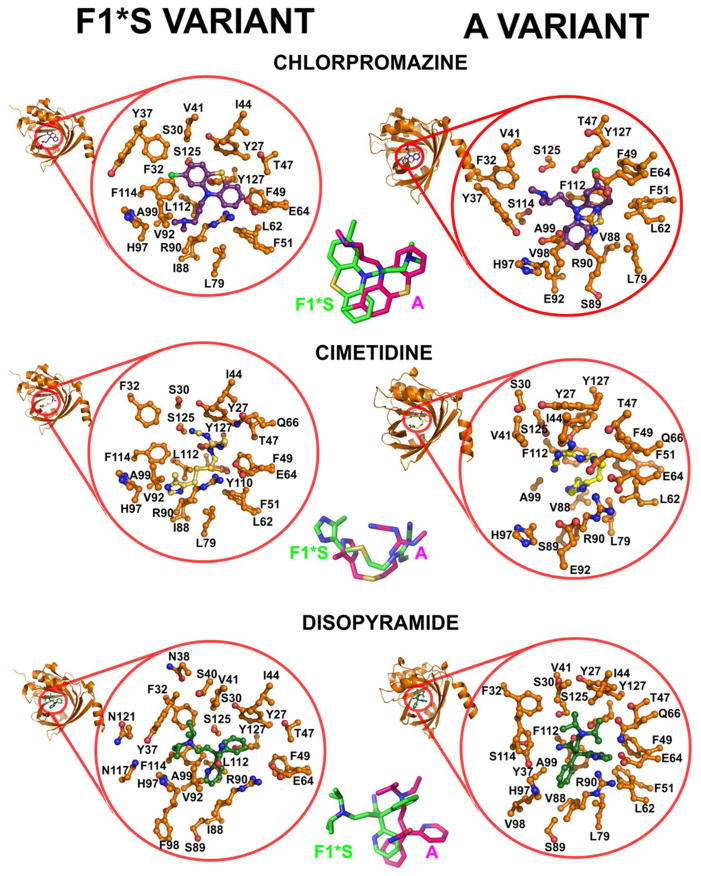
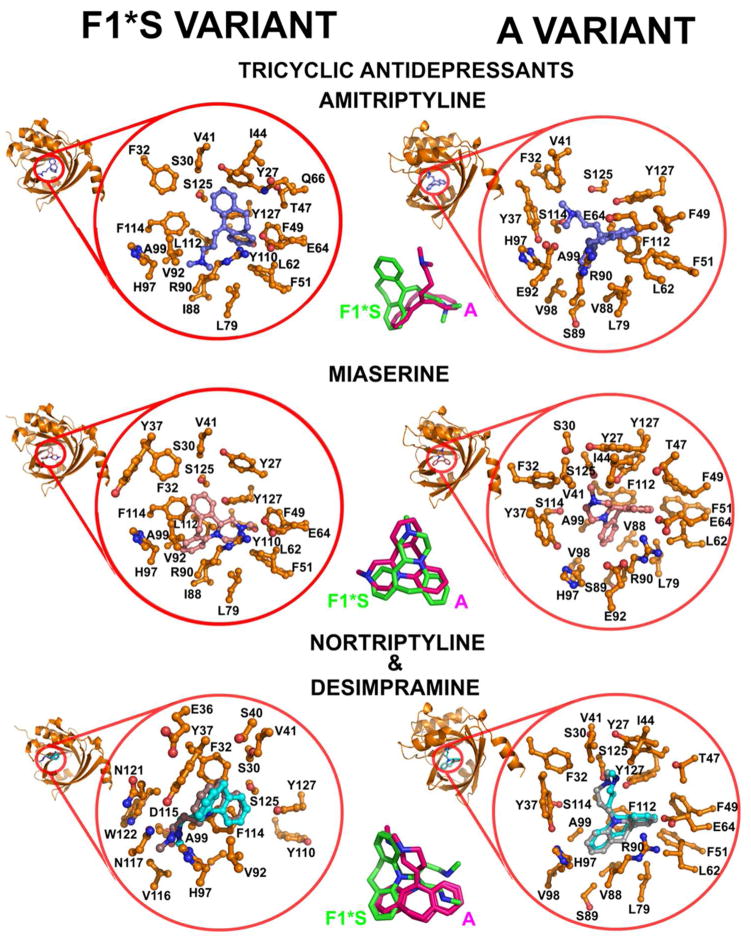
Figure 6.
Molecular docking models of the test compounds bound to the F1*S and A variants of human AGP. The mini-cartoon structure of AGP highlights the cavity region that is expanded in each docking model. The magnified expansion of the cavity shows the AGP side chain contacts within 5 Å of the bound drug. Centre panel. Stick overlays of the drug molecules in their bound orientation within the pocket of each variant.


