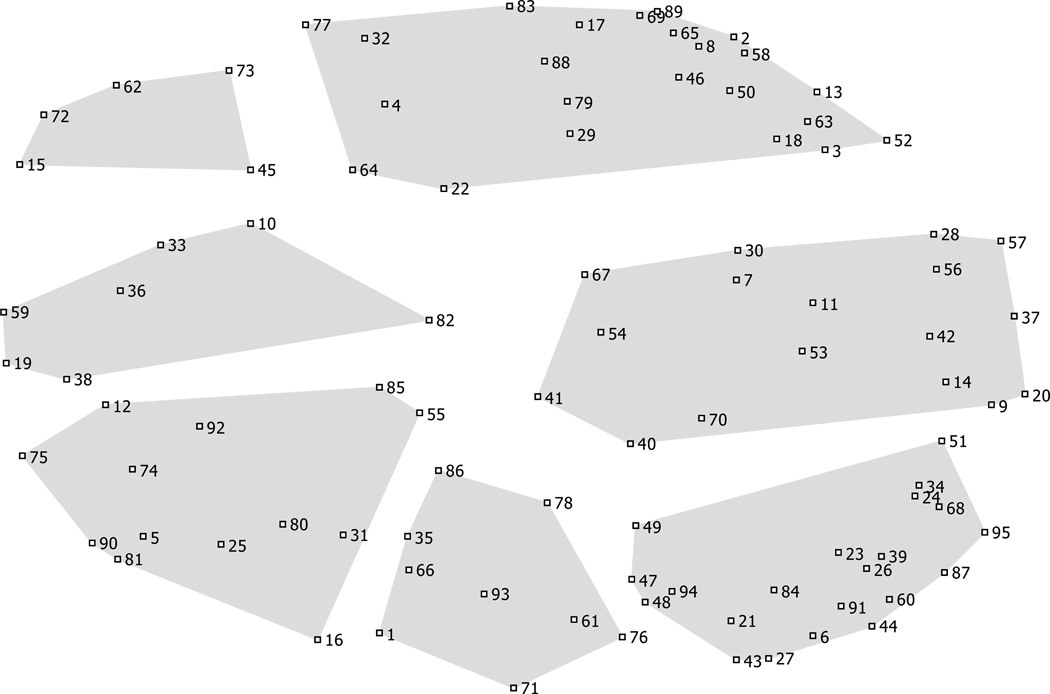
Figure 1. SciTS cluster map.
Note: Two-dimensional map of the 95 final synthesized SciTS topic statements, grouped into seven clusters. Each numbered point represents one synthesized statement (a list of all statements organized by cluster is in Table 1). Statements closer to each other are considered to be more similar in meaning than statements further away from one another. The grouping (as defined by polygon-shaped boundaries) displays the statements into related clusters

