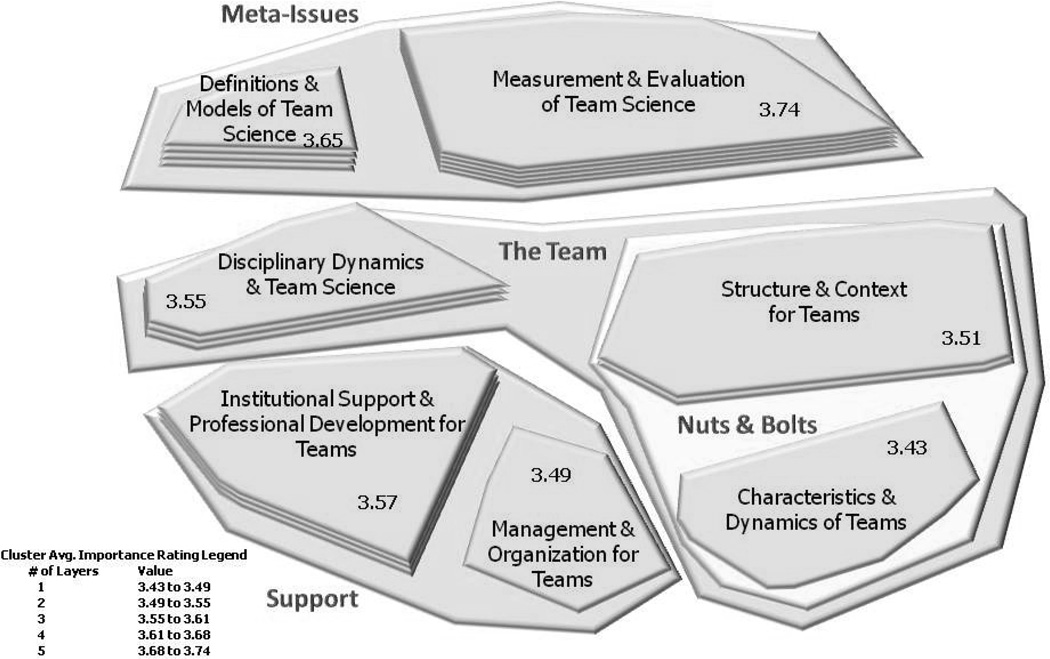
Figure 2. SciTS concept map.
Note: A comprehensive SciTS issues map showing labeled clusters and regions. Synthesized SciTS topic statements (refer to Figure 1) are no longer shown as individual points; rather, they are now grouped and represented by clusters (7), and then by regions (4). The average importance rating for each cluster is displayed inside the clusters

