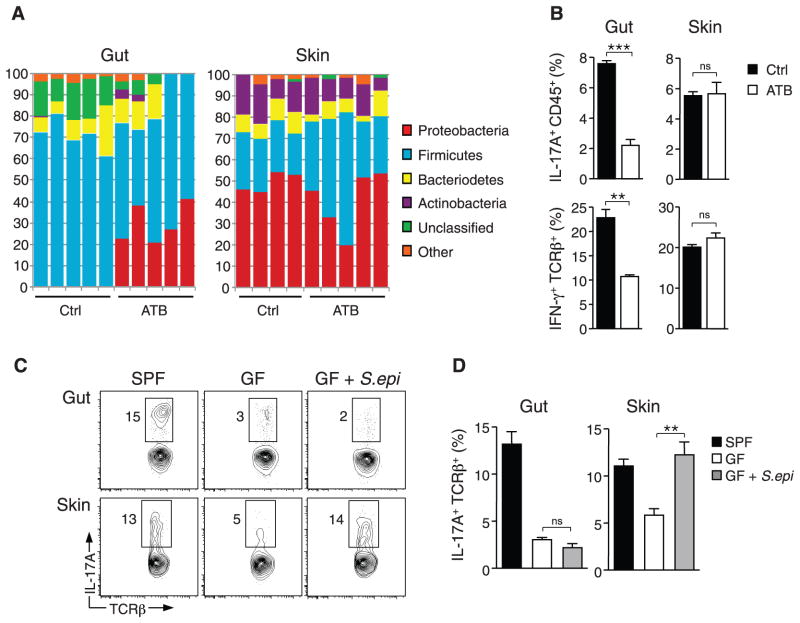
Fig. 2.
Distinct commensal niches control T cell cytokine production in the gut and skin. (A) Taxonomic classifications at the phylum level for 16S ribosomal RNA gene sequence data clustered at 97% identity from skin tissue and fecal pellet of control mice and mice treated with oral antibiotic cocktail (ATB) for 4 weeks. Each column represents an individual mouse. (B) Assessment of IFN-γ production in live CD45+ TCRβ+ cells and IL-17A production in live CD45+ cells from skin and intestine of mice treated with oral antibiotic cocktail or water (Ctrl) for 4 weeks. Graphs show means ± SEM of four mice (**P < 0.005, ***P < 0.0005; ns, not significant). Results are representative of two or three experiments. (C and D) Flow cytometric analysis of IL-17A production in live CD45+ TCRβ+ cells from the gut and skin of SPF mice, GF mice, and GF mice monoassociated with S. epidermidis (GF + S.epi) for 2 to 3 weeks. Graphs show means ± SEM of three to five mice (**P < 0.005). Results are representative of two experiments.

