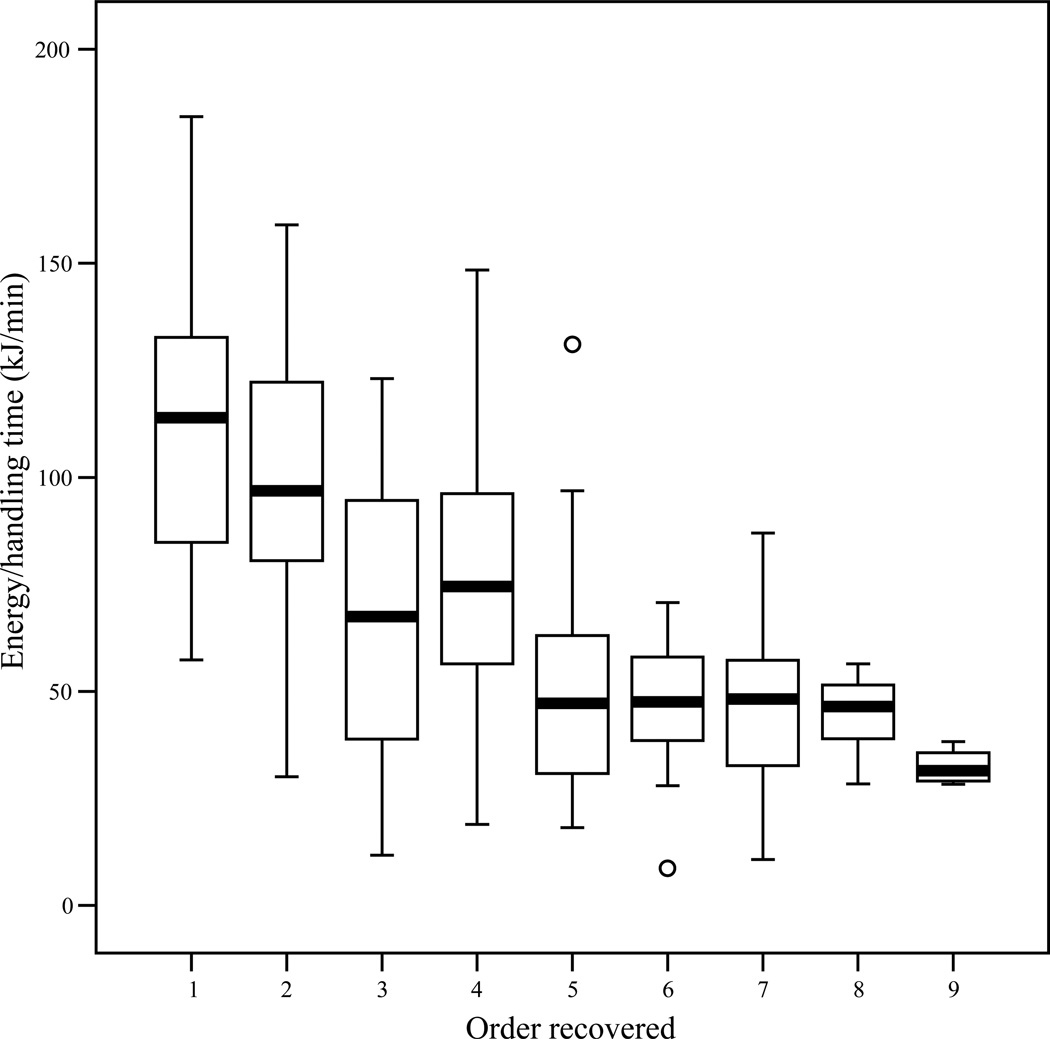
Figure 4.
Boxplot of actual profitability (observed kcal/min) versus order recovered for Panzee in experiment 3. Line denotes median, boxes extend to the 25th and 75th percentiles, and whiskers extend to observed values within 1.5 box lengths. Circles are outliers. In trials where Panzee recovered the 10th and final bag, she left the tower before eating the almonds. Therefore, actual profitability is not available for any bag recovered in this position due to lack of processing time data.

