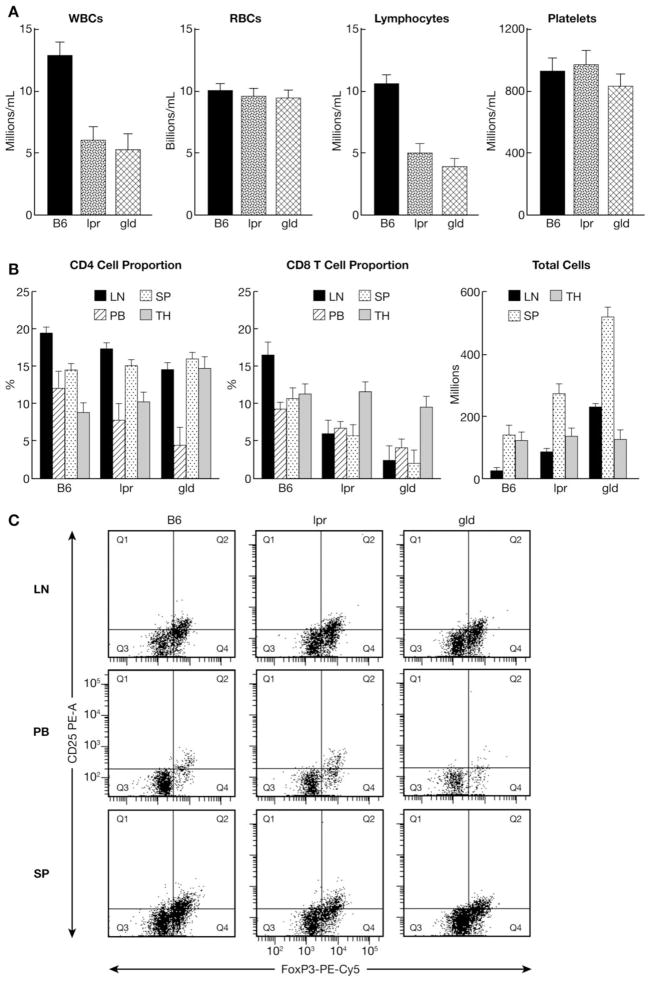
FIGURE 1.
Reduced lymphocyte proportion in lpr and gld mice. Complete blood counts were performed on B6, lpr and gld mice using Hemavet 950 (A). Proportions of CD4+ and CD8+ T cells in LN, PB, SP and TH were analyzed by FACS after staining with a CD8-PeCY5 + CD4-APC antibody mixture, while total cells in LN, SP and TH were counted by a Vicell Counter (B). The presence of CD4+CD25+FoxP3+ Treg cells in LN, PB and SP were also analyzed by FACS (C). Data shown are representative FACS dot plots or means with standard errors from six B6, six lpr mice and five gld mice used for each group.

