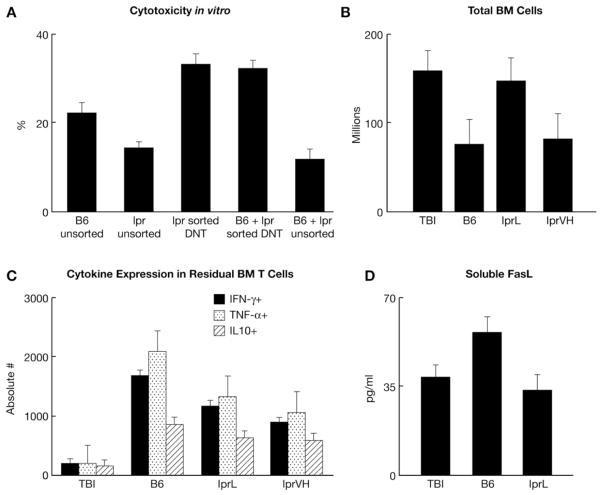
FIGURE 6.
The roles of DN T cells, cell dose, class I cytokines and soluble FasL. Sorted DN T cells from lpr donors caused increased apoptosis of C.B10 BM cell targets and did not suppress the apoptotic effect of B6 LN cells. Data shown are means with standard errors from two B6 and two lpr donors each measured in triplicates (A). Pre-irradiated (5 Gy TBI) C.B10 mice were infused with 5 × 10⁶ or 30 × 106 LN cells from lpr donors, or 5 × 10⁶ LN cells from B6 donors, to induce BM failure. Total BM cells per mouse are shown as means with standard error bars for three mice in each treatment group (B). BM cells were stained with IFN-γ-FITC, TNFa-APC and IL10-PE; cytokine profiles are shown as means with standard error bars for three mice in each treatment group (C). Serum soluble FasL levels are shown as means with standard error bars for treatment groups TBI, B6 and lprL (D).

