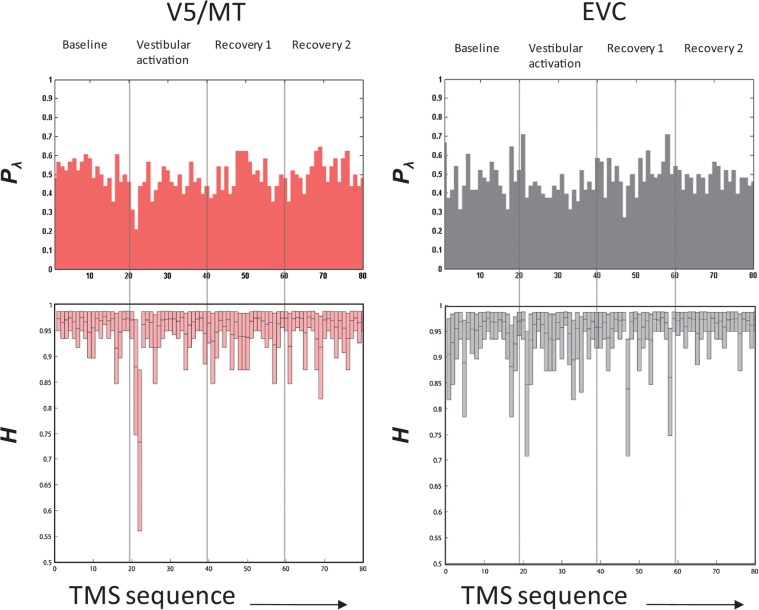
Figure 3.
Response entropy. The 4 panels (V5/MT on the left and EVC on the right) relate to response data pooled from the subjects for each TMS stimulus in a run and ordered in the sequence of presentation; that is, each run consisted of 4 phases and 20 stimuli/phase so there were 80 TMS pulses per run (x-axis of panels = 1–80). The top panels show the pooled Pλ (probability of seeing a phosphene), and the bottom panels show information entropy (H). For V5/MT, the baseline entropy is stable but a clear decline in H occurs with vestibular activation. In contrast, for EVC, the moderate decline in H with vestibular activation is comparable to the entropy spikes that seem to occur spontaneously throughout the record.

