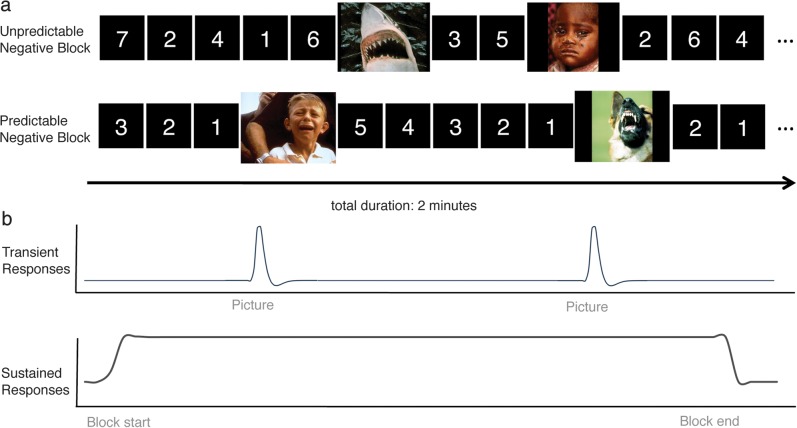
Figure 1.
Experimental design and analysis schematic. (A) Within a task block, negative or neutral pictures are presented (3 s duration) embedded within variable-duration predictable or unpredictable timings. (B) Schematic images depicting canonical transient event responses (top) that are estimated separately from sustained responses that remain persistently active throughout the blocks (bottom). This figure is for illustration purposes only and is not intended to accurately represent the actual experimental parameters.

