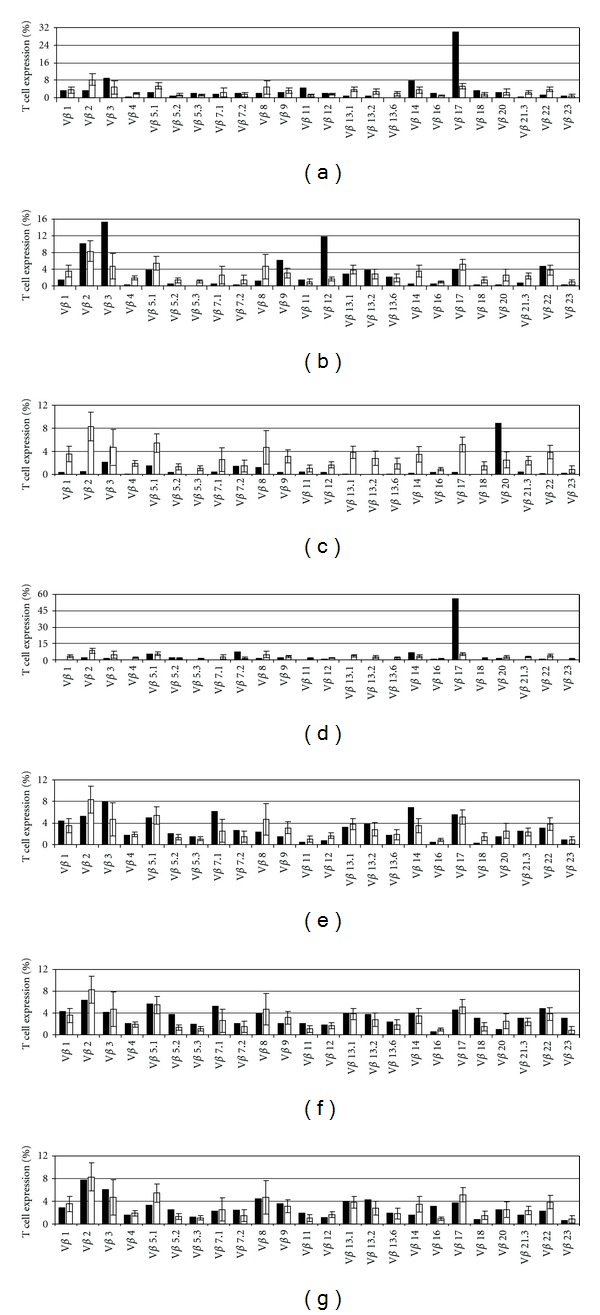
Figure 2.

T-cell receptor (TCR) Vβ repertoire. Relative expression levels of 24 different TCR Vβ families in CD3+ cells (black bars) of pt1 (a), pt2 (b), pt3 (c), pt4 (d), pt5 (e), pt6 (f), and the mother of pt1 (g) compared with the relative expression of normal healthy controls (white bars) were obtained by FACS analyses. Normal control values were obtained using the IOTest Beta Mark TCR Vβ Repertoire Kit (Beckman Coulter).
