Figure 4.

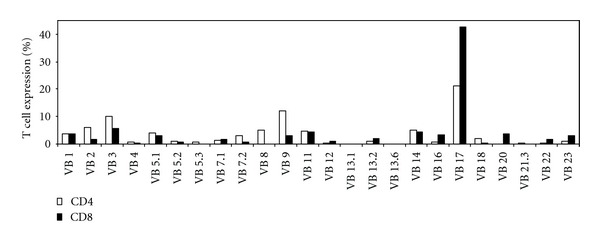
T-cell receptor (TCR) Vβ repertoire. FACS analysis of the relative expression levels of 24 different TCR Vβ families in patient 1 CD3+CD4+ cells (white bars) and CD3+CD8+ cells (black bars).

T-cell receptor (TCR) Vβ repertoire. FACS analysis of the relative expression levels of 24 different TCR Vβ families in patient 1 CD3+CD4+ cells (white bars) and CD3+CD8+ cells (black bars).