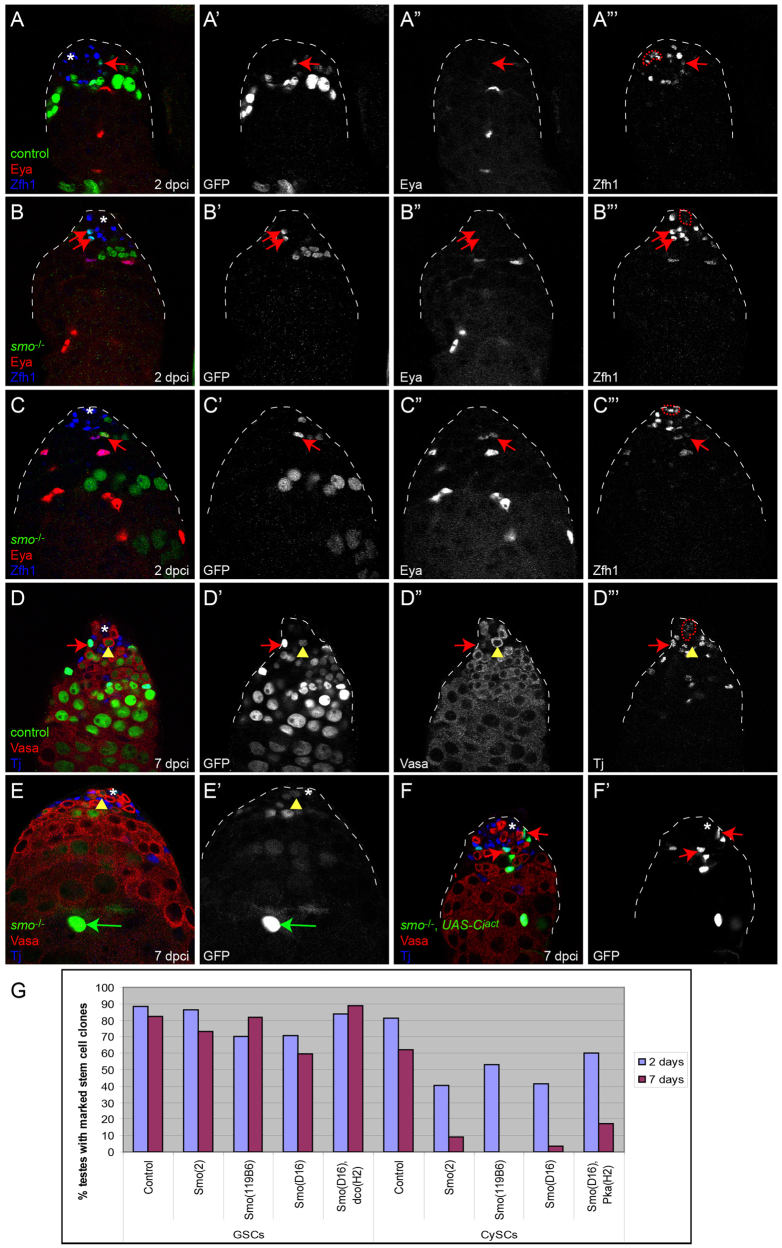
Fig. 3.
Hh signaling is required for CySC self-renewal. (A-F′) MARCM clonal analysis showing control (A,D) or smo mutant clones (B,C,E,F). (A-C″′) Control FRT40A CySC clones at 2 dpci can be recovered, as assessed by Zfh1 expression (blue) and lack of Eya (red) (A). smo mutant CySC clones can be recovered at 2 dpci (B) and express Zfh1, whereas other smo mutant clones initiate normal differentiation and begin to express Eya (C). Single channel for GFP is shown in A′-C′, for Eya in A″-C″ and for Zfh1 in A″′C″′. (D-D″′) Control FRT40A MARCM clone (green) at 7 dpci showing a marked CySC (red arrow) and GSC (yellow arrowhead) adjacent to the hub. (E-F′) smo mutant MARCM clone at 7 dpci showing a labeled GSC (yellow arrowhead) but no CySCs (E). The green arrow points to a marked differentiated cyst cell (E). smo mutant CySC clones in which Ciact is overexpressed can be recovered at 7 dpci (red arrows indicate two mutant CySCs) (F). See Table 1 for values. Vasa is red and Tj is blue in D-F. Single channel for GFP is shown in D′-F′, for Vasa in D″ and for Tj in D″′. In A-F′, the position of the hub is indicated with an asterisk in merged images and is outlined (dotted red line) in the Tj or Zfh1 single channel. (G) The recovery rates for labeled GSCs (left) and CySCs (right) at 2 and 7 dpci in negatively labeled clones. See supplementary material Table S1 for n values.

