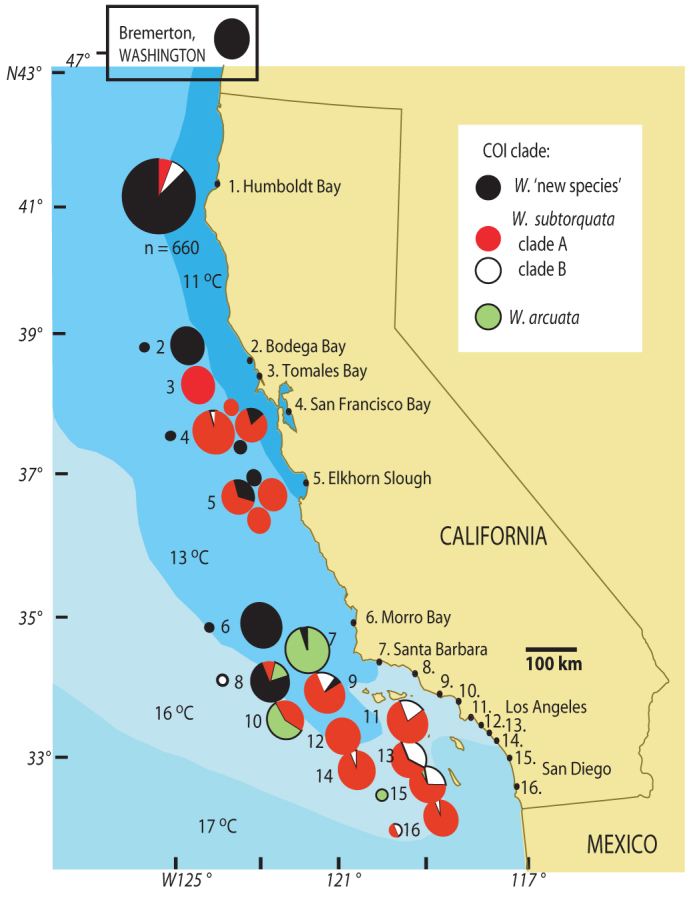
Figure 2. Distribution of Watersipora COI phylogroups in the California region, (regional mean annual sea surface temperature indicated).

Colonies were collected from 2002–2011. Circles to the left of corresponding site numbers are previously reported COI samples25. Circles are sized in proportion to the number of colonies collected at each site, except as indicated for Humboldt Bay where phylogoups of a larger number of colonies were determined using multiplex PCR35. Each circle represents a different sample location or year of sampling. Number-only labels: Port Hueneme (8), Channel Island Dock, Oxnard (9), Marina del Rey (10), Long Beach Harbor (11), Huntington Harbor (12), Dana Point (13), Newport Harbor (14), Oceanside (15), Mission Bay (16).
