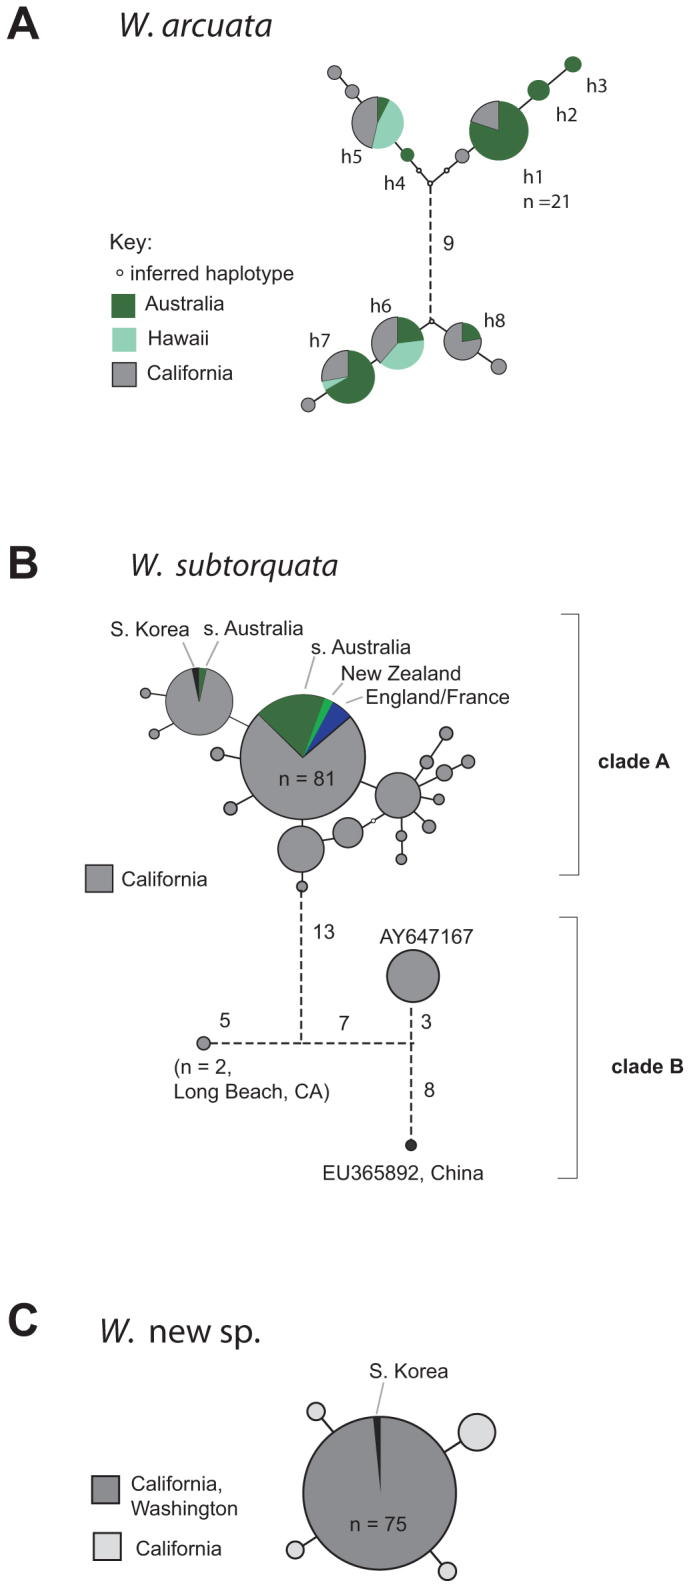
Figure 3. Parsimony networks describing relationships of COI haplotypes of Watersipora, introduced to California and other areas.

Continuous straight lines represent connections with >95% confidence68 and dashed lines represent connections with confidence below this limit. Circles indicating sampled haplotypes are scaled according to haplotype frequency. The frequency of the most common haplotype in each set is shown. W. arcuata haplotypes, h1–h8, were defined previously23.
