Figure 3.
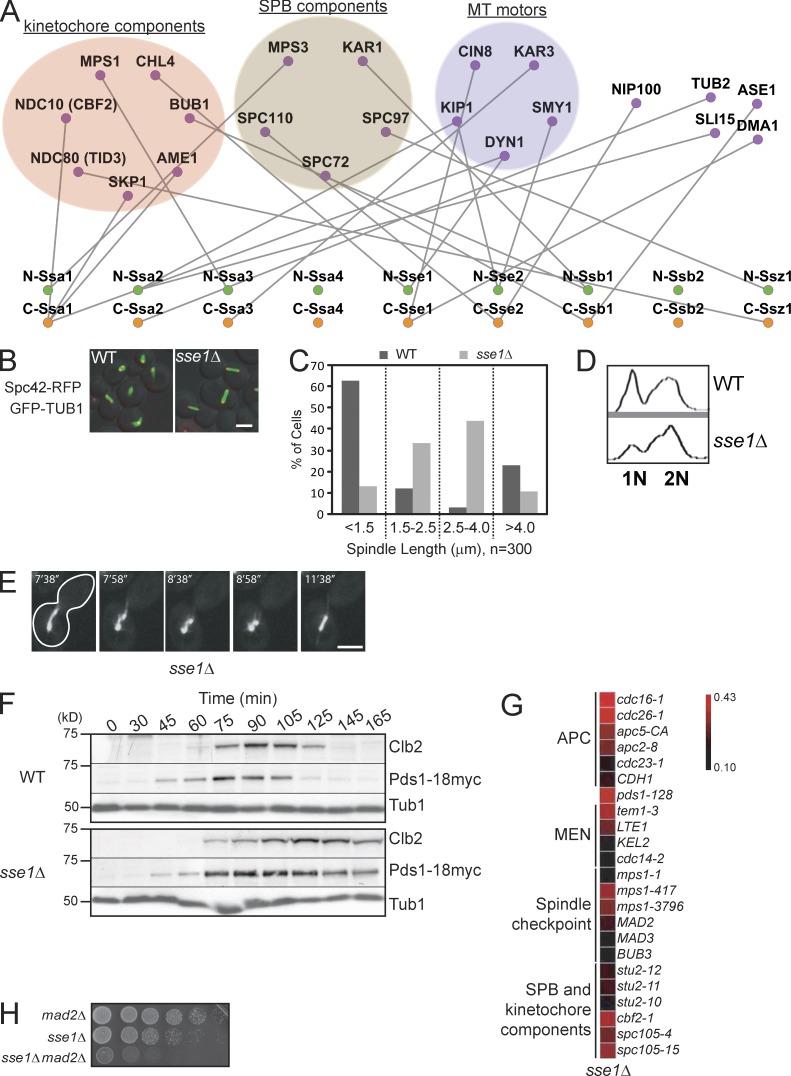
The role of Hsp70/Hsp110 in spindle organization. (A) A subnetwork of the Hsp70/Hsp110 protein interactions (also refer to Fig. 1 and Table S2) highlighting TAP tag–based physical interactions between N- and C-tagged Hsp70/Hsp110 and components of SPB, kinetochore, and MT motors. (B) The fluorescence images show spindle morphology examined by confocal microscopy in logarithmically growing WT and sse1Δ strains at 30°C containing an SPB marker, endogenous Spc42-RFP (red), and harboring the pGFP-TUB1 (green) plasmid. Bar, 5 µm. (C) Bar graph showing the distribution of spindle lengths observed in WT and sse1Δ cells. The data shown are from a single representative experiment out of three repeats. (D) FACS profiles of WT and sse1Δ cells. 3 ml of early log–phase culture was used. (E) The spindle of an sse1Δ cell was visualized using plasmid-borne GFP-Tub1 and examined by time-lapse confocal microscopy. The cell outline is traced by the white line. Bar, 5 µm. (F) Logarithmically growing cultures of WT and sse1Δ expressing Pds1-18myc were synchronized in G1 with α-factor (time = 0 min). α-factor was then removed, and cells were grown at 26°C in YPD. Samples were taken at the indicated time points, and total cell lysates were analyzed by Western blot analysis using antibodies directed against cMyc, Clb2, and tubulin. Molecular mass markers are shown on the left of the gels. (G) A synthetic genetic array subnetwork highlighting genetic interactions between sse1Δ and genes involved in chromosome segregation and cell cycle progression. APC and MEN refer to anaphase-promoting complex and mitotic exit network, respectively. The intensity of the red color correlates with the strength of the genetic interaction (refer to Costanzo et al. [2010]). (H) 10× serial dilutions of log-phase cells of the indicated genotypes spotted onto YPD and incubated at 26°C for 2 d are shown.

