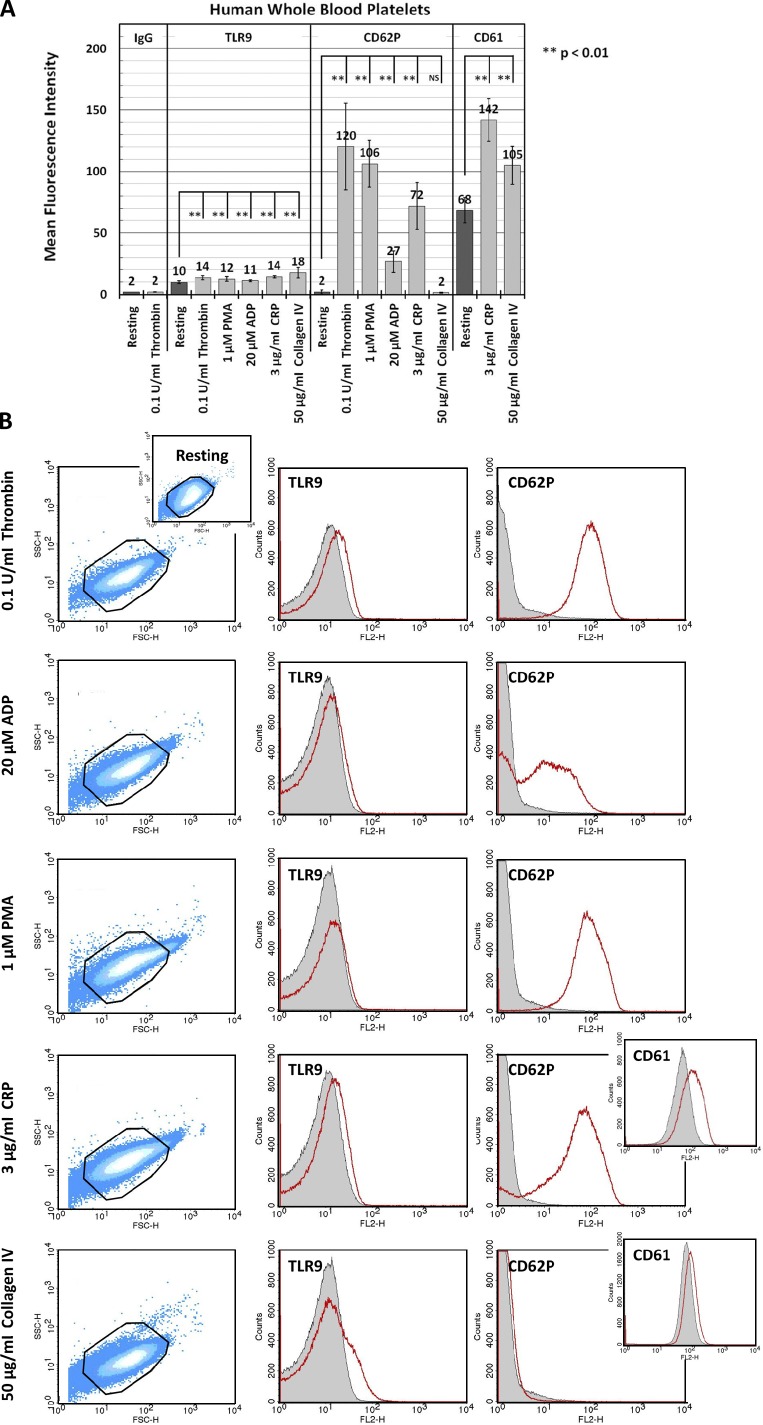
Figure 6.
Human PLTs regulate surface expression of TLR9 on activation with select agonists. Human PLTs were collected from whole blood and examined under resting conditions or after activation with 1 mU/µl thrombin, 1 µM PMA, 3 µg/ml CRP, 20 µM ADP, or 50 µg/ml mouse type IV collagen for 5 min at 37°C. Samples were probed for TLR9 and either CD62P or CD61. PLT mean fluorescence intensity (relative surface expression of targeted receptor) was determined by flow cytometry for at least three different samples, and data were subject to one-way ANOVA and Tukey HSD analysis. Error bars represent one standard deviation about the mean for at least three independent samples. (A) Human PLT activation with all listed agonists results in increased surface expression of TLR9 relative to resting control. Strikingly, TLR9 surface expression on PLT activation did not correlate with CD62P/CD61 expression for the agonists tested and suggests that TLR9 and CD62P/CD61 may localize to separate granules. (B, left) Representative forward scatter versus side scatter dot plots highlight characteristic changes in PLT morphology on activation with the listed agonists relative to resting control. (right) Representative histograms demonstrate a shift in mean fluorescence intensity for TLR9 and CD62P/CD61 on PLT activation. Outlines represent PLT gate used for sample thresholding by forward and side scatter. Mean fluorescence intensity for resting PLTs is represented in gray. Mean fluorescence intensity for agonist-activated PLTs is represented in red.

