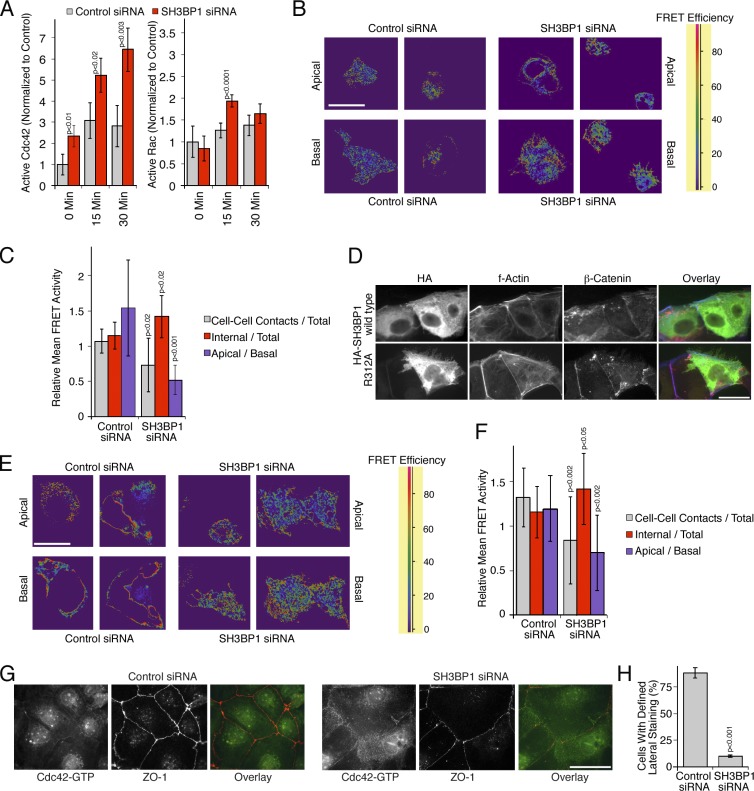
Figure 7.
Spatial regulation of Cdc42 activity by SH3BP1. (A) Levels of active Cdc42 and Rac1 were measured after serum starvation and stimulation with EGF in total cell extracts after transfection of either control or SH3BP1-targeting siRNAs. Shown are means ± 1 SD (n = 3). (B and C) A431 cells were first transfected with siRNAs and then with a biosensor to measure Cdc42 activity. The cells were then serum starved before stimulating for 10 min with EGF. FRET efficiency was then measured by confocal microscopy. Shown are apical and basal sections. A FRET efficiency scale is shown for the color coding (high FRET efficiency reflects high Cdc42 activity). B shows a quantification of the FRET images, using apical sections to compare internal and cell–cell contact signals and ratios of apical versus basal mean FRET signals. Shown are means of different fields ± 1 SD (n = 11). (D) HA-tagged SH3BP1 constructs encoding the wild-type or a GAP-deficient mutant (R312A) were transfected, and effects on F-actin and β-catenin were analyzed by immunofluorescence and epifluorescence microscopy. (E and F) Caco-2 cells were first transfected with siRNAs and then with the Cdc42 biosensor. FRET efficiency was then measured by confocal microscopy. Shown are apical and basal sections. FRET images were quantified as in C. Shown are means of different fields ± 1 SD (n = 12). (G and H) Caco-2 cells were transfected with siRNAs and then analyzed by immunofluorescence using antibodies against GTP-bound Cdc42 and ZO-1. H shows a quantification of the number of cells with a defined lateral Cdc42 staining as opposed to the diffuse lateral staining observed in SH3BP1-depleted cells. Shown are means ± 1 SD from six different fields (n = 6). Bars, 10 µm.

