Figure 3.
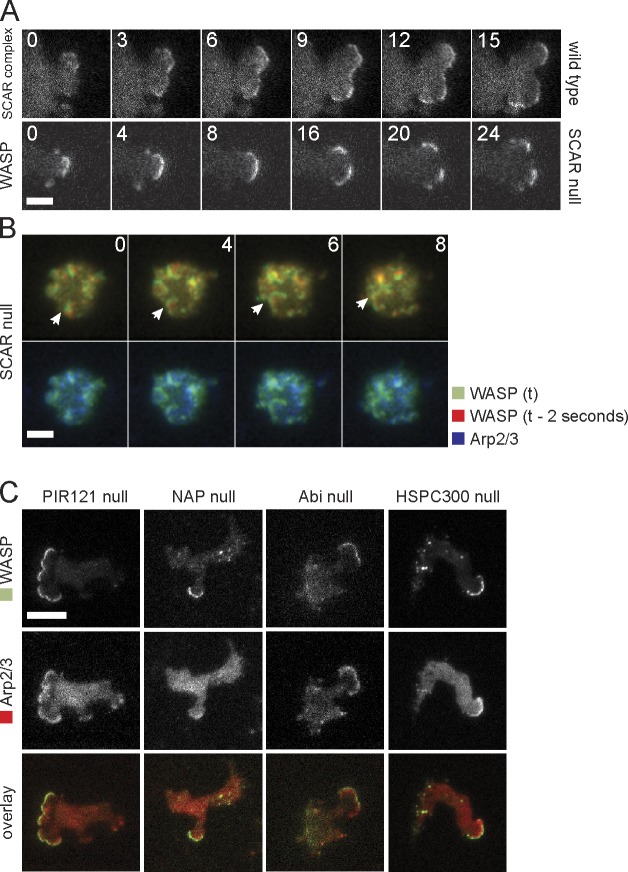
WASP dynamics in SCAR complex mutants. (A) TIRF image series of splitting pseudopods in a wild-type cell labeled with HSPC300-GFP and a SCAR knockout cell labeled with GFP-WASP. Cells are moving to the right, and time is indicated in seconds. (B) TIRF image series of WASP waves in a SCAR-null cell. In the top images, this image is overlaid with the localization of WASP 2 s before the current frame, and in the bottom images, this image is overlaid with the Arp2/3 complex. A single-pass Gaussian blur was applied to the full image to smooth background fluorescence. The arrow tracks a single WASP wave. (C) TIRF images of GFP-WASP and RFP-tagged Arp2/3 complex in strains deleted for PIR121, Nap1, Abi, and HSPC300. Bars, 5 µm.

