Figure 4.
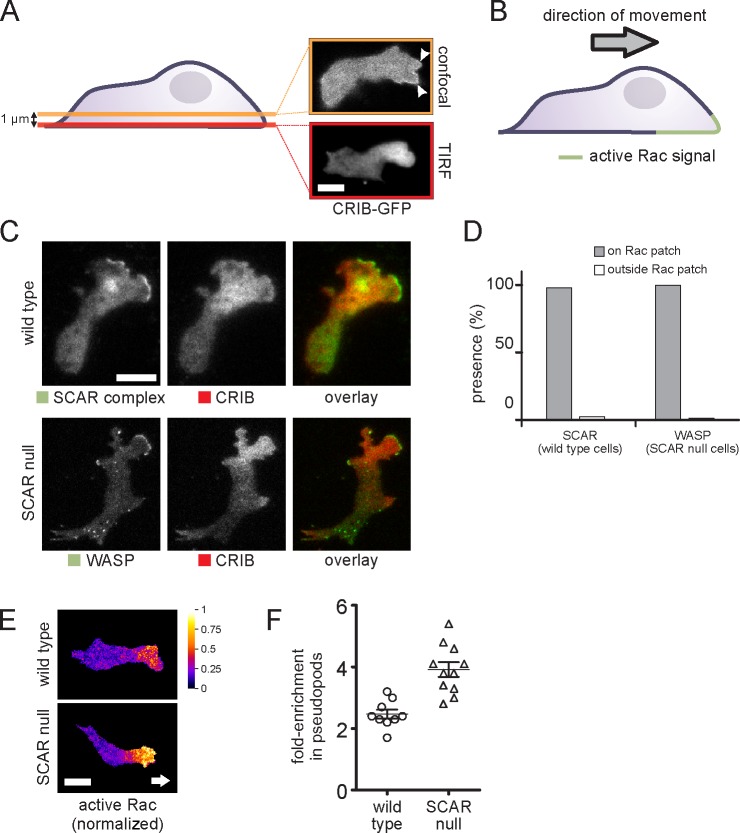
Correlation between WASP, SCAR, and active Rac. (A) Visualization of the active Rac marker CRIB-GFP in a migrating cell in a confocal slice at a position 1 µm above the basal membrane (confocal) and directly on the basal membrane (TIRF). Arrowheads mark active protrusions. (B) Schematic drawing of the distribution of active Rac in a migrating cell. (C) TIRF image of a migrating cell coexpressing the active Rac marker CRIB-RFP and a marker for the SCAR complex (HSPC300-GFP) or GFP-WASP. (D) Quantification of the number of visible SCAR and WASP protrusions that are located on active Rac patches and outside of active Rac patches, respectively (n = 130 pseudopods from two experiments). (E) CRIB-GFP and free RFP were coexpressed in the indicated cells and visualized using TIRF microscopy. Active Rac distribution was normalized by dividing the CRIB-GFP signal by the free RFP signal. Background signal outside of the cell was masked. Arrow indicates cell’s direction. (F) Short videos of cells coexpressing CRIB-GFP and free RFP were recorded. Active Rac levels were normalized as described in E. The fold enrichment of active Rac in pseudopods in the normalized image was calculated by dividing the mean pixel value of the pseudopod by the mean pixel value of the cytosol. For each cell, the fold enrichment in pseudopods of each cell is plotted. Each data point is the mean of at least three pseudopods. The difference between the means is significant (Student’s t test, P < 0.001). Lines and error bars indicate means ± SEM. Bars, 5 µm.

