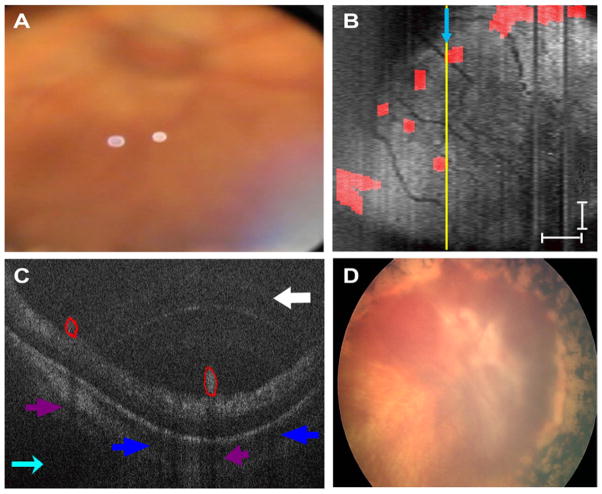
Figure 3.
Patient 1’s right eye. A, Representative video-indirect ophthalmoscopy image without evidence of preretinal tufts and clear optic nerve head margins. B, Sum voxel projection of the preretinal tissue (red areas in C) demonstrates close proximity of preretinal structures to blood vessels. The yellow line corresponds to the location of the cross-sectional spectral domain optical coherence tomography (SD OCT) image in (C). Light blue arrows provide image orientation (B, C). Scale bars are 1000 μm. C, Cross-sectional SD OCT image demonstrates preretinal structures outlined in red. White arrow points to an arcing imaging artifact, dark blue arrows correspond to shadowing from retinal blood vessels, and purple arrows correspond to shadowing from preretinal structures. D, Retcam fundus photograph demonstrates tractional retinal detachment with dense pre-retinal fibrosis over the optic nerve and macula 1 month after SD OCT imaging.

