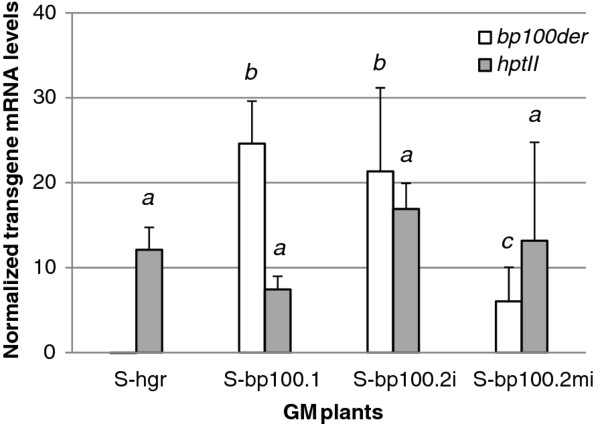
Figure 3.
Transgene mRNA expression levels (relative to actin) in leaves of in vitro grown homozygous T3 plants, as assessed by RT-qPCR. Means and SD of GM events carrying every transgene are shown. Three biological replicates per GM event were analyzed, each with leaves of ten plants at the two-leaf stage. Letters indicate statistically different bp100der mRNA values (one-way ANOVA, Tukey's b posttest α < 0.05).

