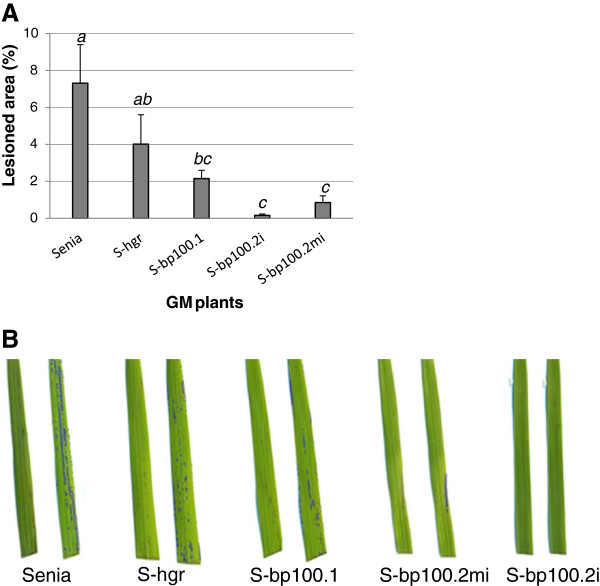
Figure 6.
Tolerance to H2O2 treatment (oxidative stress) of control untransformed Senia and S-bp100.1, S-bp100.2i, S-bp100.2mi and S-hgr GM plants in a detached leaf assay.(A) Ten plants from every homozygous line obtained were analyzed. Means and standard errors of the percentages of affected areas are represented as a function of the transgene in each line. Letters indicate statistically significant differences (one-way ANOVA, Tukey’s-b posttest with α value < 0.05). (B) Representative examples of leaves subjected to H2O2 treatment. The right of each pair, labeled in blue, shows NBT stained areas used to calculate percentages of lesion areas (APS assess tool).

