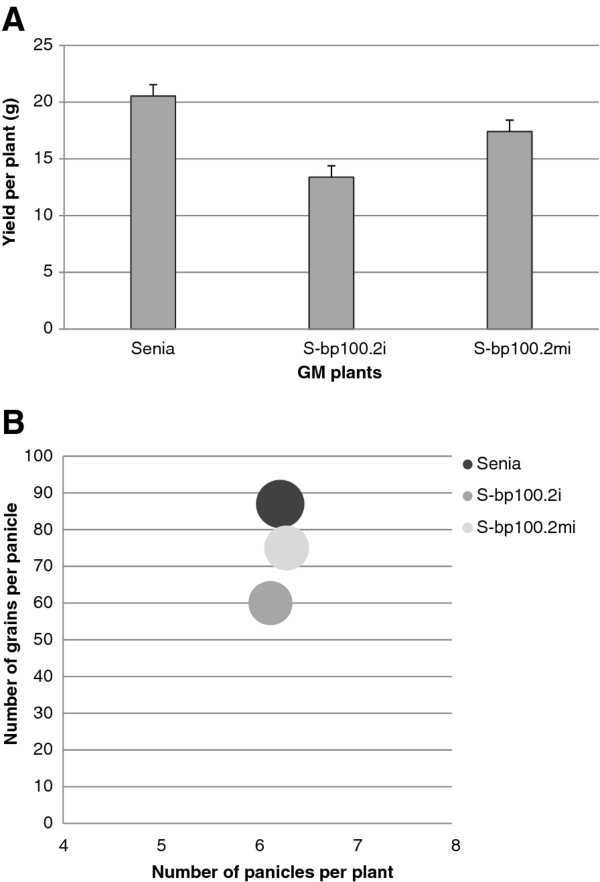
Figure 7.
Comparison of agronomic characteristics of untransformed Senia, S-bp100.2mi and S-bp100.2i rice plants (T3 homozygous lines).(A) Yield of the different plants as evaluated by the weight of all panicles per plant at harvesting stage. Letters indicate statistically significant differences (one-way ANOVA, Tukey’s-b posttest with α value < 0.05). (B) Dispersion plot showing the number of grains per panicle (X-axis), number of panicles per plant (Y-axis) and weight of 100 grains (circle sizes are proportional to the weight of 100 grains). For S-bp100.2i and S-bp100.2mi, data from all the different events were merged.

