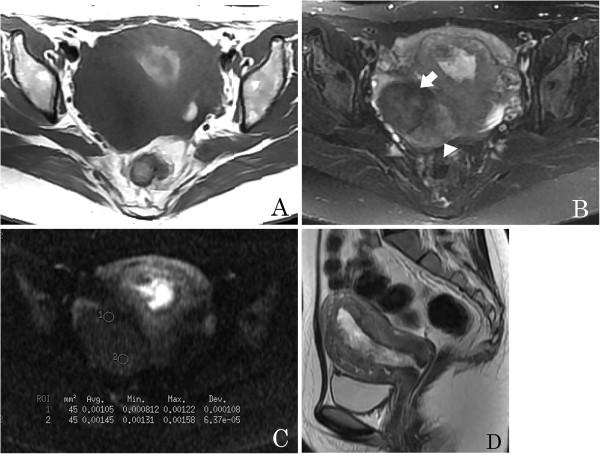
Figure 2.

A 27-year-old woman with an ovarian fibrothecoma. (A) An axial T1-weighted image shows a right ovarian mass with hypointensity. (B) Axial T2-weighted image shows a solid heterogeneous signal mass; the area containing abundant fibrous tissue has marked low signal intensity (arrow) and the area containing an abundant thecoma component has intermediate signal intensity (arrowhead). (C) On axial diffusion-weighted imaging (DWI), the apparent diffusion coefficient (ADC) value of the fibrous tissue area is very low (circle 1, ADC = 1.05 × 10⁻³ mm2/s) and that of the thecoma component is very high (circle 2, ADC = 1.45 × 10- 3 mm2/s). (D) Sagittal T2-weighted image demonstrates endometrial thickening.
