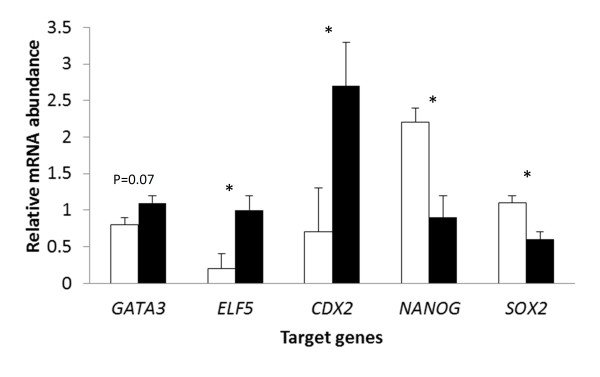
Figure 1.
Differences between inner cell mass (ICM) and trophectoderm (TE) in expression of 6 select genes as determined by quantitative PCR. Blastocysts were harvested at Day 7 and ICM and TE separated by magnetic activated cell sorting. Data represent least-squares means ± SEM of results from six biological replicates. Open bars represent ICM and filled bars TE. *=P<0.05.

