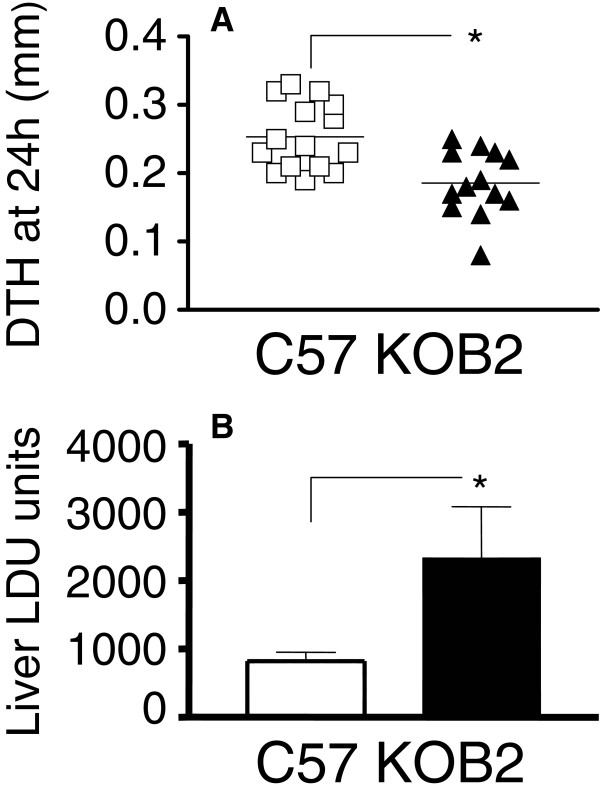
Figure 2.
Increased parasite tissue burden and impaired DTH response in B2R deficient mice. (A) The y-axis represents the individual results of the thickness of skin reaction in mm at 24 h after intradermal injection of 107 freeze–thawed stationary phase promastigotes, as measured on day 28 after infection in B2R+/+ (C57) and B2R−/− mice (KOB2). The values of the contra-lateral saline control were subtracted from the reaction due to Leishmania antigen. Data represent the results of three independent experiments performed with 3–5 mice for each treatment. (B) The y-axis represents the average liver parasitic load in Leishman-Donovan units of Stauber (LDU= number of amastigotes / 1000 cell nuclei × organ weight in mg) of two independent experiments (5 mice/treatment), at 30 days after infection with 3 x 10 7 amastigotes of Leishmania (L.) chagasi. T bars represent the SE values. Asterisks indicate significant differences between groups as disclosed by the Mann Whitney analysis.

