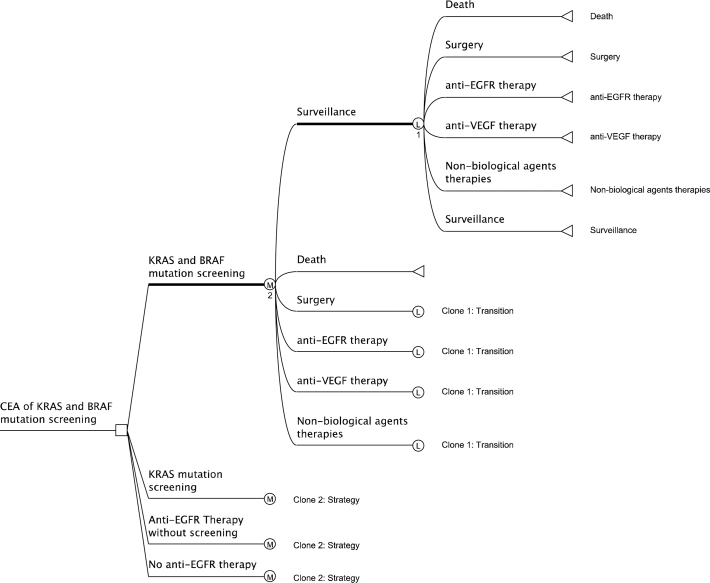
Figure 1.
Markov model of disease progression and treatment in metastatic colorectal cancer. Clone 1, Clone 2 are clone copies of the master clone subtrees 1 and 2, indicated by the respectively numbered heavy lines. The clone copies have the same structure as but can have different calculations from the master clone subtrees. Legend:  : Terminal node (the outcome because of following a path);
  : Logical node (logical decisions are made based on logical structure in the node);
  : Markov node (indicates the presence of a hidden or shown Markov subtree at the node);
  : Decision node (indicates the point of decision, which in our case is choosing between the four strategies); KRAS = V-Ki-ras2 Kirsten rat sarcoma viral oncogene homolog, BRAF = serine/threonine-protein kinase B-Raf, EGFR = epidermal growth factor receptor, VEGF = vascular endothelial growth factor.

