
Figure 2.
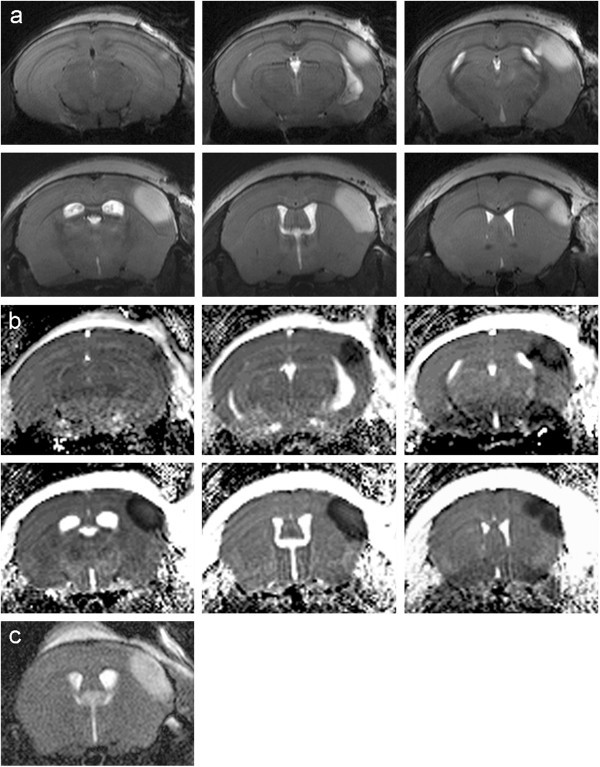
T2-weighted RARE images using the cryo-probe of consecutive slices acquired 24 h after MCAo clearly demonstrate the infarcted region (a). ADC maps calculated of the diffusion-weighted images showing a significant decrease of the ADC in the ischaemic region (b). Slice positioning is identical to Figure 2a. T2-weighted RARE image of the same mouse using a 1H linear birdcage resonator (72 mm i.d.) instead of the cryo-probe (c).