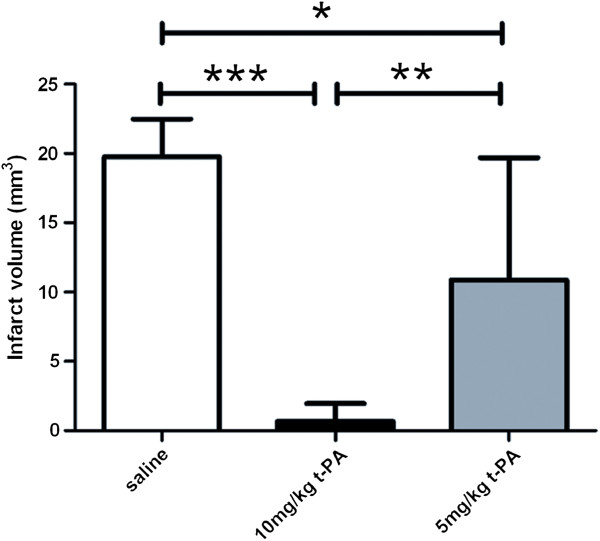
Figure 4.

Volume of the ischemic lesion of controls (white bar) and t-PA treated mice with 10 mg/kg (black bar) and 5 mg/kg (grey bar) quantified by MRI 9.4 T - T2 images. ***, p < 0.0001, **, p < 0.001 and *, p < 0.05, one-way ANOVA, Bonferroni post-hoc test.
