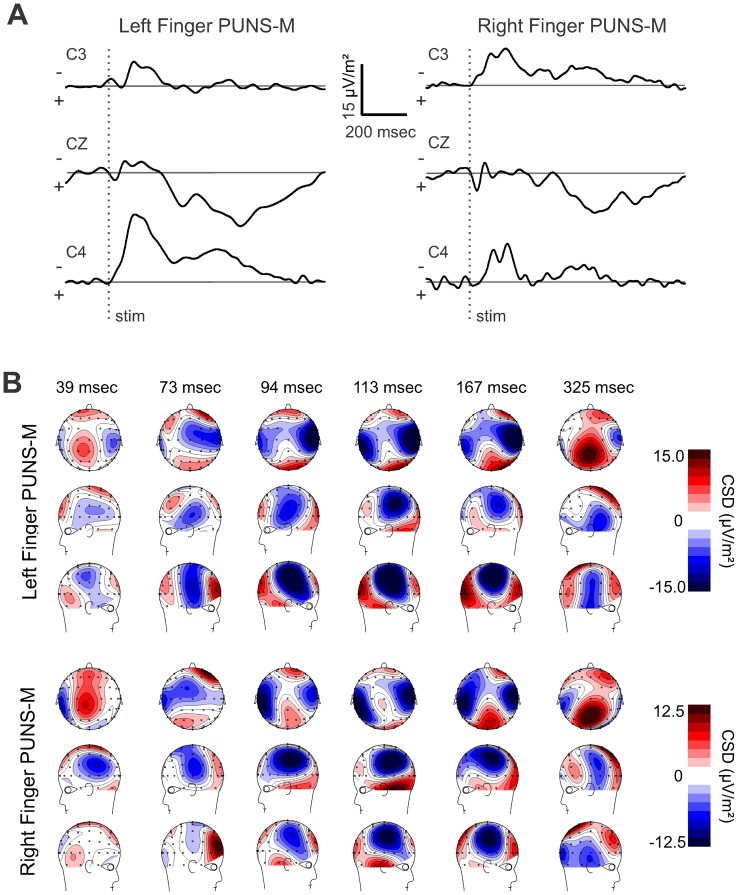
Figure 3. Stimulation of fingertips with PUNS-M reveals dynamic current sources.
(A) Grand average current source density (CSD) traces obtained from five subjects in response to left (left) and right (right) fingertip stimulation with PUNS-M waveforms are displayed across time for C3 (top), CZ (middle), and C4 (bottom) electrode sites where (−) indicates current sink and (+) indicates current source. (B) Pseudocolor topographic CSD maps corresponding to data illustrated in A for left finger (top panel) and right finger (bottom panel) stimulation with PUNS-M are illustrated for times following stimulation as indicated.

