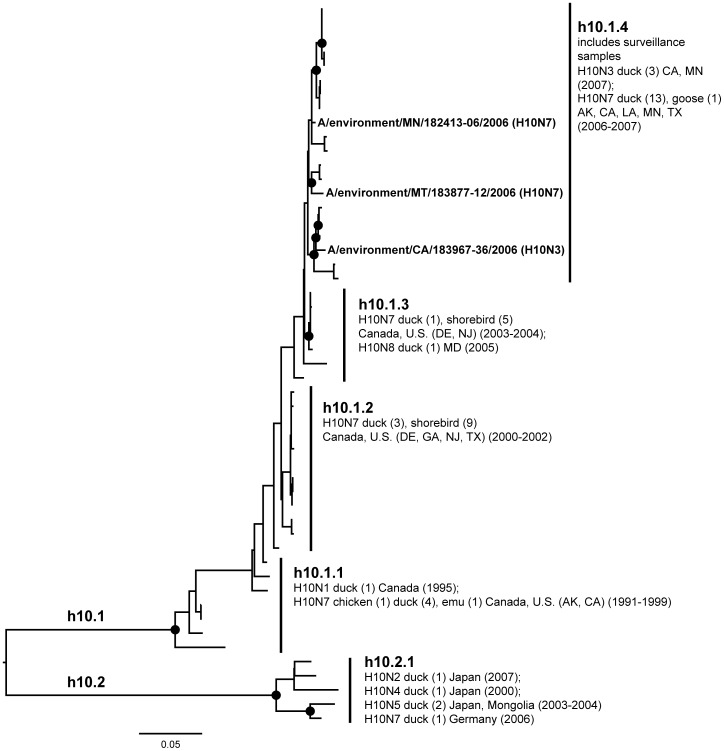
Figure 10. ML phylogram of H10 sequences from North America and Eurasia including U.S. surveillance samples.
ML phylogram of influenza A subtype H10. Branch lengths represent genetic distance. Dots show nodes with significant bootstrap support. USDA surveillance sequences from avian fecal samples are shown in bold.

