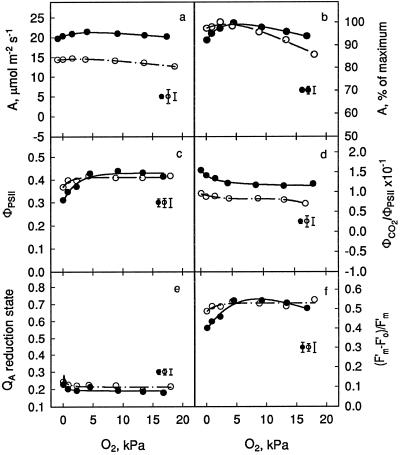
Figure 3.
O2 effects on the net CO2 assimilation (a), net CO2 assimilation as a percentage of the maximum rates (b), quantum yield of PSII (c), electron use efficiency for CO2 assimilation (d), reduction state of the QA pool (e), and efficiency of PSII open centers (f) in A. edulis wild-type plants. Measurements were made at an ambient CO2 concentrations of 93 (•) and 33 Pa (○), with corresponding intercellular CO2 values of 28.3 ± 3.7 and 15.8 ± 0.9 Pa, respectively. Error bars are the Fisher lsd values at α = 0.05. Error bar without symbol is the Fisher lsd value for the O2 × CO2 interaction.

