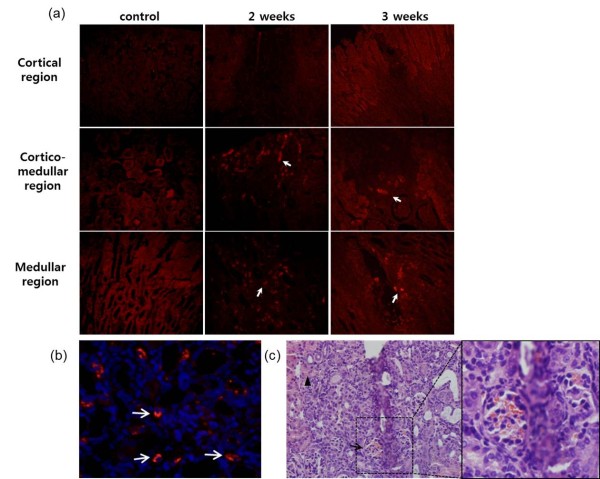
Figure 6.
Tracking of nanoparticle-labeled ATMSCs in the kidney. (a) Transplanted silica nanoparticle-labeled ATMSCs were detected at the cortical medullary junction and in the medullary region at 2 and 3 weeks after injection. Fluorescent cells were not observed in the cortical region. Many fluorescent cells were unambiguously detected (arrows) in the corticomedullary and medullary regions. Cortical region: Magnification, ×100; corticomedullary and medullary region: Magnification, ×200. (b) ATMSC-injected kidneys were stained with DAPI and examined by confocal laser scanning microscopy. Arrowhead indicates co-localization of fluorescent silica nanoparticles and DAPI nuclear staining. Magnification, ×200. (c) The injection site was clearly observed in H&E-stained sections. Hemorrhages (black arrow) were detected and mild necrosis (black arrow head) was observed near the injection site. Magnification, ×100. The hemorrhagic region in (c) was magnified to show more detail. Magnification, ×400.

