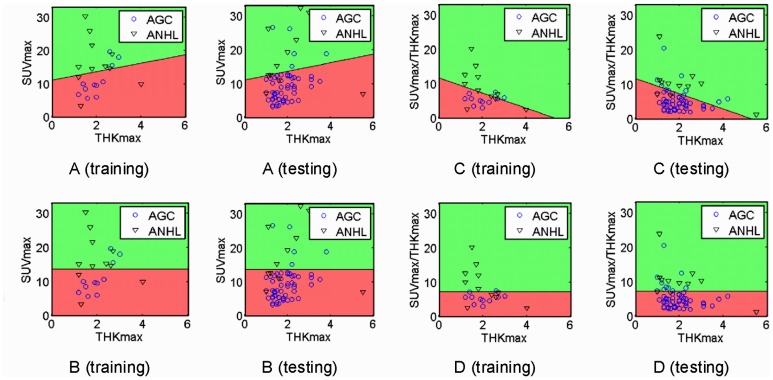
Figure 3. Linear classification analysis with SUVmax and CT-determined maximal thickness (THKmax) (A, training and testing), SUVmax alone (B, training and testing), normalized SUVmax (SUVmax/THKmax) and THKmax (C, training and testing) and SUVmax/THKmax alone (D, training and testing).
Different colors represent the distribution of advanced gastric carcinoma (AGC) (red) and aggressive non-Hodgkin’s lymphoma (ANHL) (green) samples predicted by the classifier. AGC (ANHL) samples located in the red (green) region are correctly classified samples and those in the green (red) region are incorrectly classified samples. The THKmax value in plots of the bottom row (B and D) is for illustration only, not used for classification.

