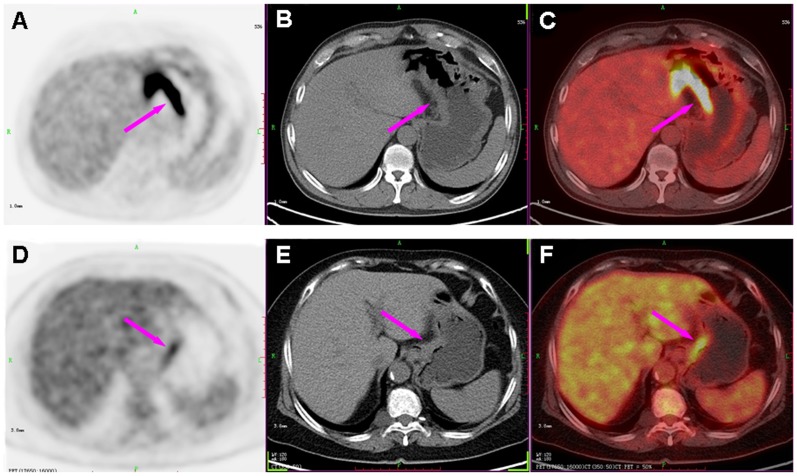
Figure 4. Comparison of PGL and AGC with representative cases.
PET (left column), CT (middle column) and PET/CT fused images (right column) of a 56-year-old male with diffuse large B-cell lymphoma (A, B and C) and a 69-year-old female with poorly differentiated AGC (D, E and F), showing gastric lesions in the lesser curvature of stomach with similar thickness of the gastric wall (THKmax: 1.4 vs. 1.6 cm; arrows in B, E). However, the SUVmax was higher for PGL (SUVmax of 22.78; arrow in A) than AGC (SUVmax of 5.24; arrow in D).

