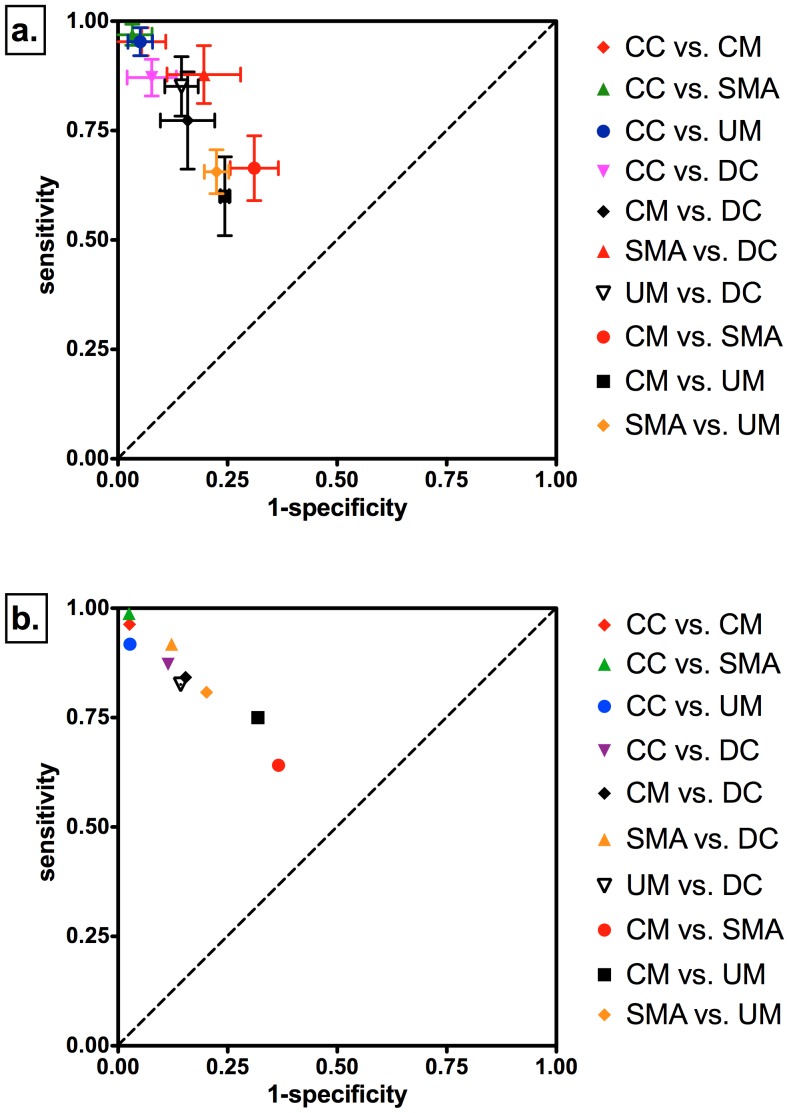
Figure 2. Discriminatory performance of proteome profiles across study groups in ROC space.
CM = Cerebral Malaria; SMA = Severe Malarial Anemia; UM = Uncomplicated Malaria; DC = Disease Controls; CC = Community Controls. (a.) Discriminatory performance in ROC space of predictive models built with relevant m/z clusters using the discovery cohort data. Error bars indicate +/− standard deviations obtained by 100 train/test randomizations of the data. (b.) Discriminatory performance in ROC space of the best predictive model from (a.) when applied to the validation cohort data.

