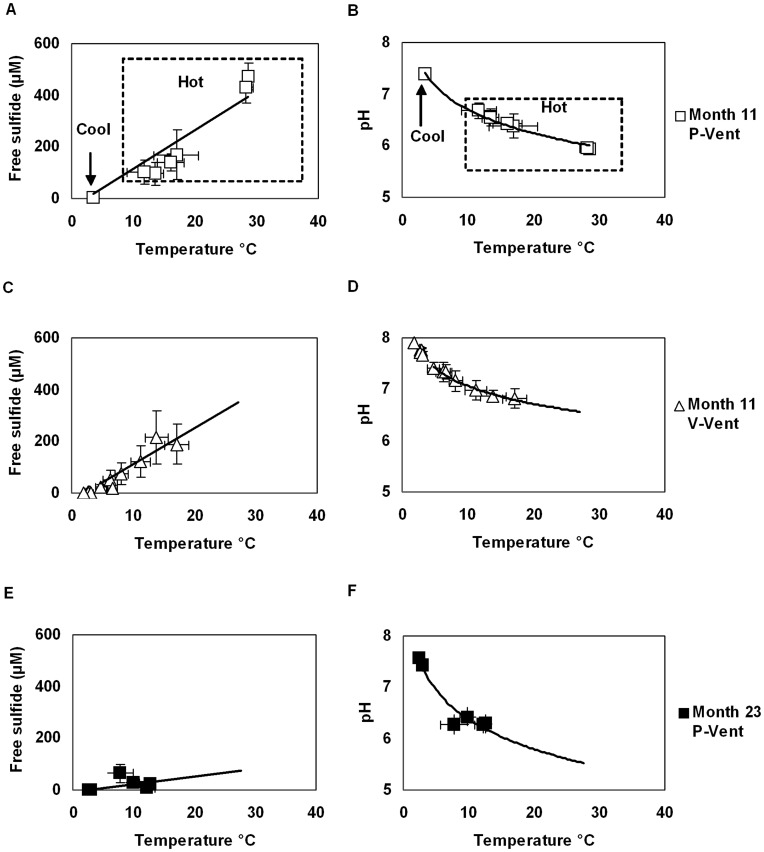
Figure 2. Variability of habitat conditions at P-vent and V-vent at 11 and 23 months after eruption.
Mean and standard deviation are displayed for each measurement location. Free sulfide and pH are displayed as function of temperature, together with the corresponding regression curve (linear and logarithmic models respectively). Curves were extrapolated to 30°C in C–F for comparison. (A, B) hot and cool habitats at 11 months at P-vent; (C, D) hot and cool habitats at 11 months at V-Vent; (E, F) hot habitat at 23 months at P vent. Statistics for individual scans are in Table 2; statistics pooled for sites are in Table S1.

