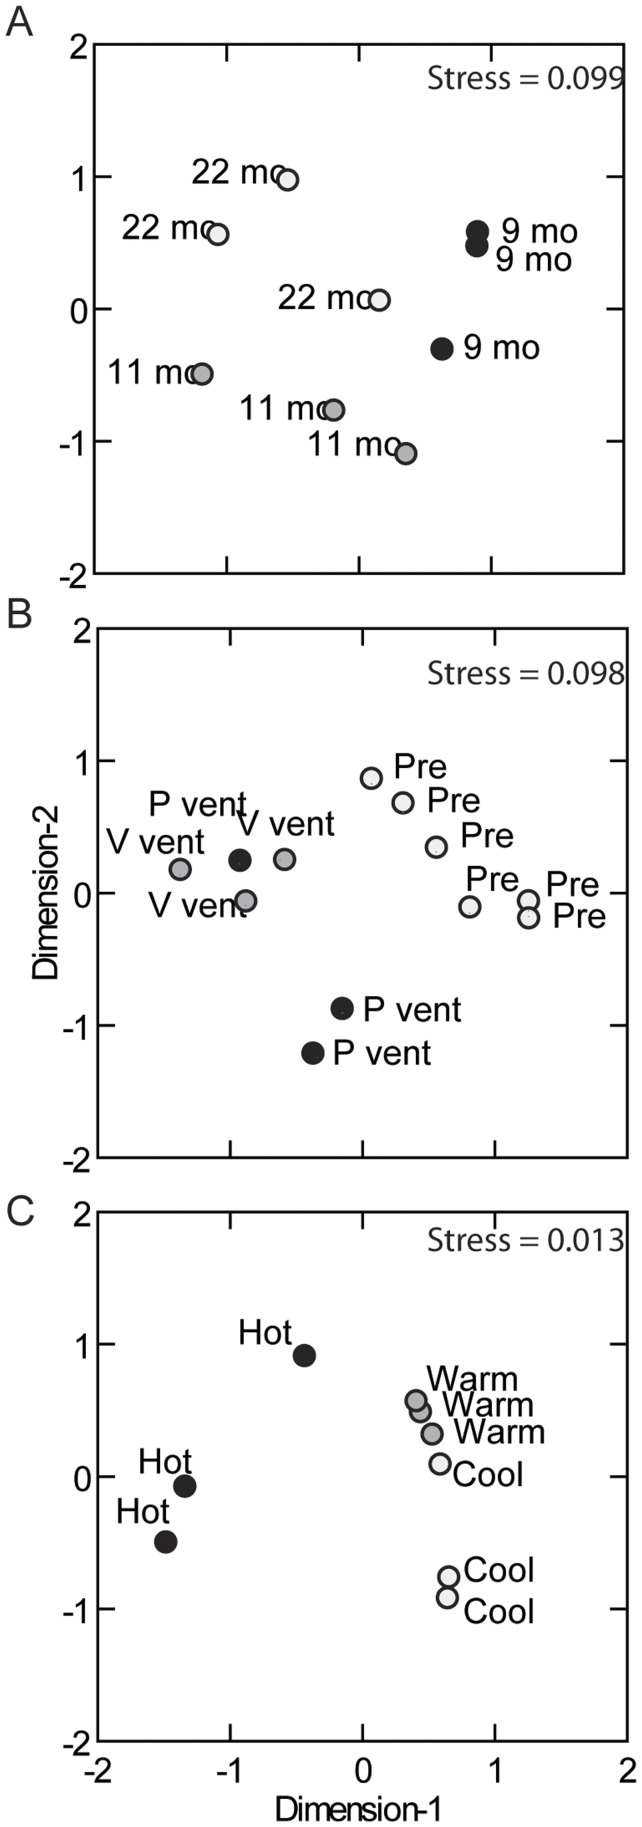
Figure 3. Non-metric multidimensional scaling analysis (nMDS) of colonist species composition.
Closely clustered symbols correspond to samples with similar species composition and abundance. Comparisons are made: (A) across Time (9, 11 and 22 months after eruption at P-vent hot habitat); (B) between Disturbance history (pre-eruption at Biovent and Worm Hole hot habitat, and post-eruption at P-vent and V-vent hot habitat); and (C) between Habitat (hot, warm and cool habitat at P-vent, 11 months post-eruption). Stress values near zero indicate that most of the variance in species abundance was accounted for in the analysis.

