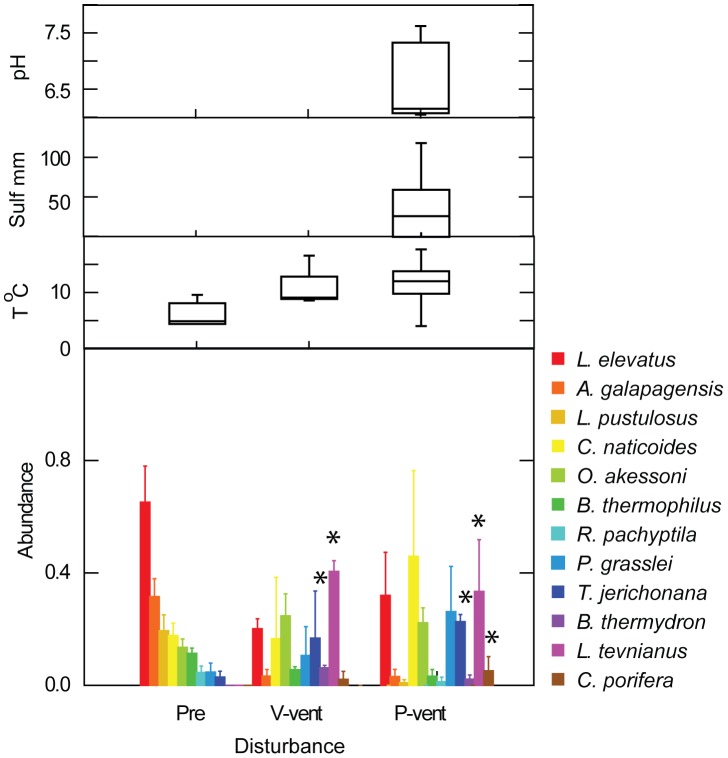
Figure 6. Variation of fauna and fluid environment with disturbance history at P-vent, V-vent and pre-eruption.
Species abundance (mean and standard error; arcsine square-root transform of relative abundance) of selected species in pre-eruption samples in 9°50′N region (Pre) and in 22-month, post-eruption samples at P- and V-vents, all in hot habitat. Asterisk denotes abundance significantly greater than at least one other condition in ANOVA (Table S3) or Kruskal Wallace test. Environmental conditions, displayed as box plots (median, quartiles, range) measured in vicinity of colonization surfaces with Alvin T-probe alone (Pre-eruption and V-vent) or in combination with electrochemical sensors coupled with T-probes (P-vent).

