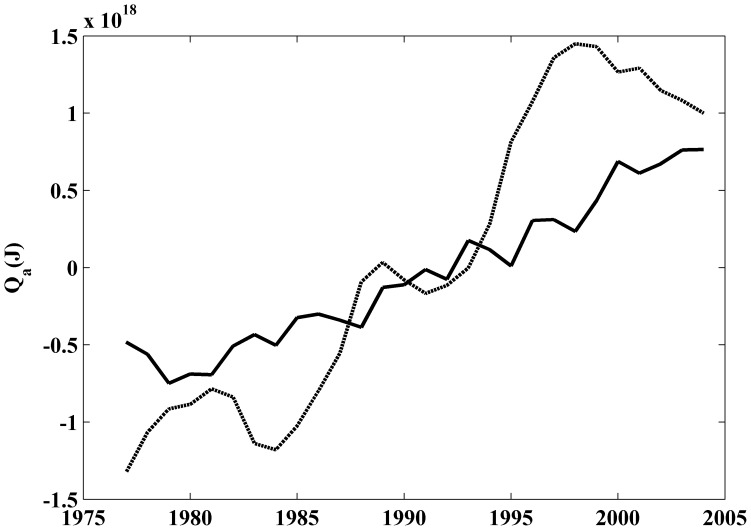
Figure 6. Time evolution of the heat content anomaly (Q (J)) meridionally averaged from 38.25 to 43.25°N over the period 1975–2006.
The black solid line is the mean of the three nearest locations to the coast and the grey dashed line is the mean of the three most oceanward locations. A running average of ±2 years was considered to smooth the signal.

