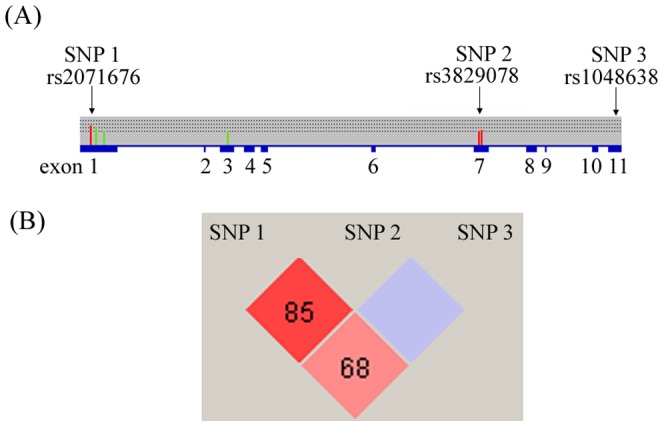
Figure 1. Linkage disequilibrium (LD) and haplotype block structure of the CA9 gene.

Numbers in the diamonds represent the pair-wise D’ values. This plot was generated by the Haploview program.

Numbers in the diamonds represent the pair-wise D’ values. This plot was generated by the Haploview program.