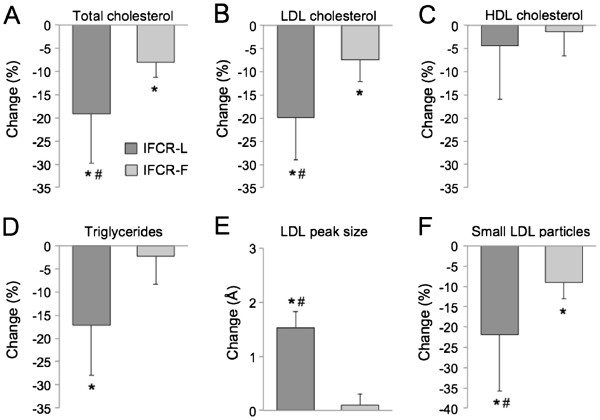
Figure 2.
Changes in lipid indicators of coronary heart disease risk during the weight loss period. Values reported as mean ±SEM change between week 3 and 10. IFCR-L: Intermittent fasting calorie restriction-liquid diet (n = 28); IFCR-F. Intermittent fasting calorie restriction-food based diet (n = 26). A. Total cholesterol. B. LDL cholesterol. C. HDL cholesterol. D. Triglycerides. E. LDL peak particle size. F. Proportion of small LDL particles. *Week 3 values significantly (P < 0.05) different from week 10 values within E group (Repeated-measures ANOVA). # Significantly different (P < 0.05) between the IFCR-L and IFCR-F group (Repeated-measures ANOVA).

