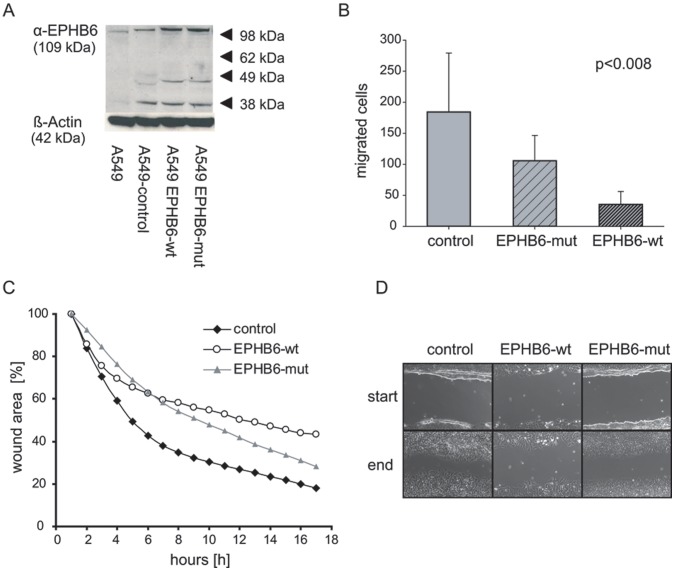
Figure 2. Migration analysis of EPHB6 expressing NSCLC cells.
A) Protein expression of stably transfected A549 cell lines expressing wild type EPHB6 or the EPHB6 deletion mutant. Cells were co-transfected using an EGFP -pcDNA3.1+ vector for identification of selected clones. Multiple clones were pooled and further selected as bulk cultures. B) Transwell migration assays were performed with empty vector control cells, EPHB6 mutant and EPHB6 wildtype cells. Five different experiments in triplicates were analyzed. *: significant (p<0.05) differences by (EITHER ANOVA OR t-test) The provided p-value between the three different cell lines was statistically analyzed from all migrated cells by using the OneWay ANOVA-test. The analysis of the pair-wise t-test results in a significant p-value for the control cells vs. EPHB6-wt cells (p<0.015) and between the EPHB6-wt cells and the EPHB6-mut cells (p<0.005). C) In vitro wound healing scratch assay. Cells were scratched by a 10 µl pipette tip. The scratch areas were recorded over a periode of 17 hours. Shown are means of three different experiments, calculated as percentage from one initial point for all three cell lines. The ANOVA-test (p<0.002) indicated statistically significant differences between the three cell lines. D) Representative images of the scratch assays at the beginning and the end of the experiments.

