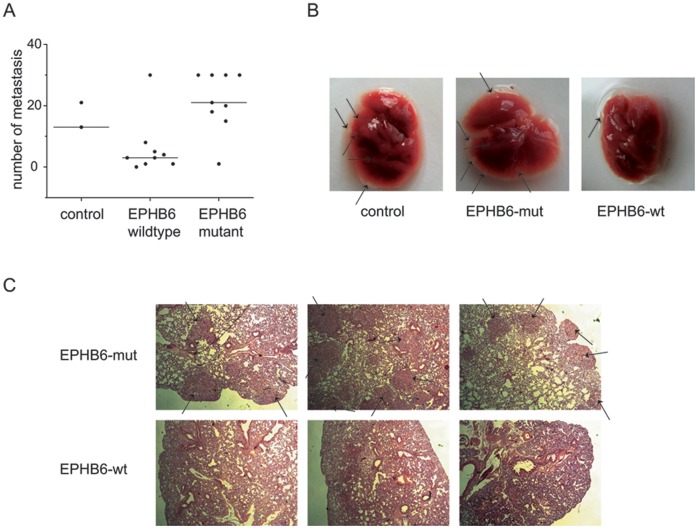
Figure 3. Development of metastasis in vivo.
A) Number of pulmonary metastases in evaluable NOD/SCID mice four weeks after transplantation, each with 3×10⁵ stably transfected A549 cells expressing EPHB6-wt (n = 9), EPHB6-del915-917 (n = 9) or empty vector control cells (n = 2). Dots represent individual mice and horizontal lines the median value of metastases. B) Images from representative whole lungs of NOD/SCID mice, transplanted with A549 cells expressing EPHB6-wt, EPHB6-del915-917, or empty vector control. Lung metastases are marked by black arrows. C) Images from lung sections of NOD/SCID mice, stained with hematoxylin. Metastases are marked by black arrows. Three representative examples are shown each for mice transplanted with A549 cells expressing EPHB6-wt or EPHB6-del915-917.

