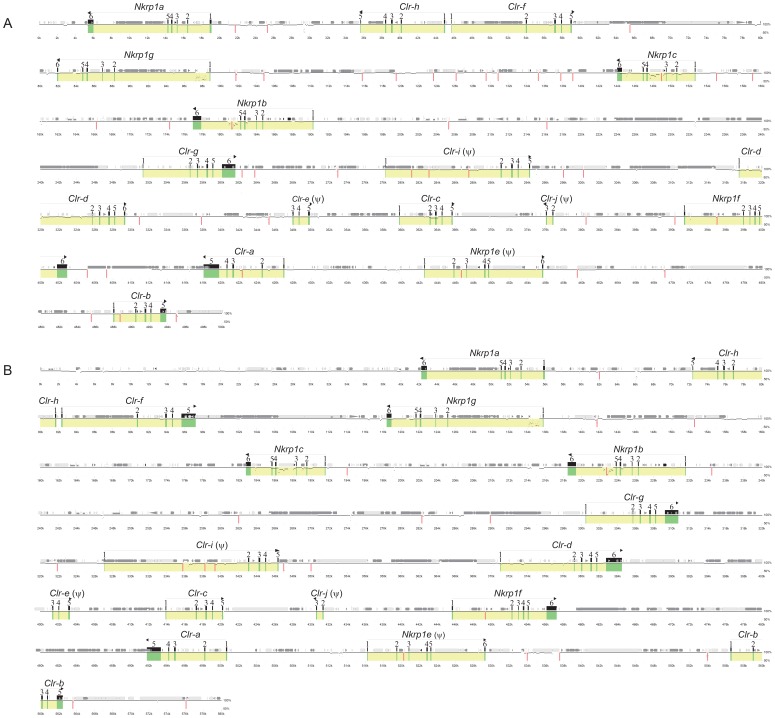
Figure 2. A graphical representation of the organization of the Nkrp1-Clr gene cluster in (A) 129S6 and (B) BALB/c inbred mouse strains.
A minimal BAC tiling path was selected from previous BAC mapping reports and next-generation sequencing was performed. Contigs were assembled using GS data analysis software. Genes were identified by Lasergene, using 10–20 nucleotide sequences of Nkrp1/Clr cDNAs from 129S6 or BALB/c mice. Advanced Pipmaker was used to construct a scale diagram of the exons and a PIP vs. the B6 Nkrp1-Clr cluster sequence (single coverage). Genes and exons are marked in yellow and green, respectively. The sequence is demarcated below the plot in kilobases. Arrows show gene orientation, and the common gene name is above the arrow. Obvious pseudogenes are denoted with a ψ. The locations of various kinds of repetitive elements were revealed with RepeatMasker and are shown (see key in Figure 1). Vertical red bars indicate gaps between contigs. Accession numbers for the cluster sequences are given in the Materials and Methods.

